

Generating a business report is an everyday affair among business professionals.
To sum, business report is a summary of your business information in an analytical, concise, and organized format.
You can have an overview of the entire business operations, be it the total customer base to your company's bottom line, instantly.
We make it easy for you to generate reports with a few simple steps. With the help of Deskera Report Builder, you can build reports with great accuracy and speed.
Let the automation in Deskera Report Builder do the work for you.
How do I use the report builder on Deskera?
To generate report using Deskera Report Builder, follow the steps below:
- Login to your Deskera account.
- Next, click on the link here.
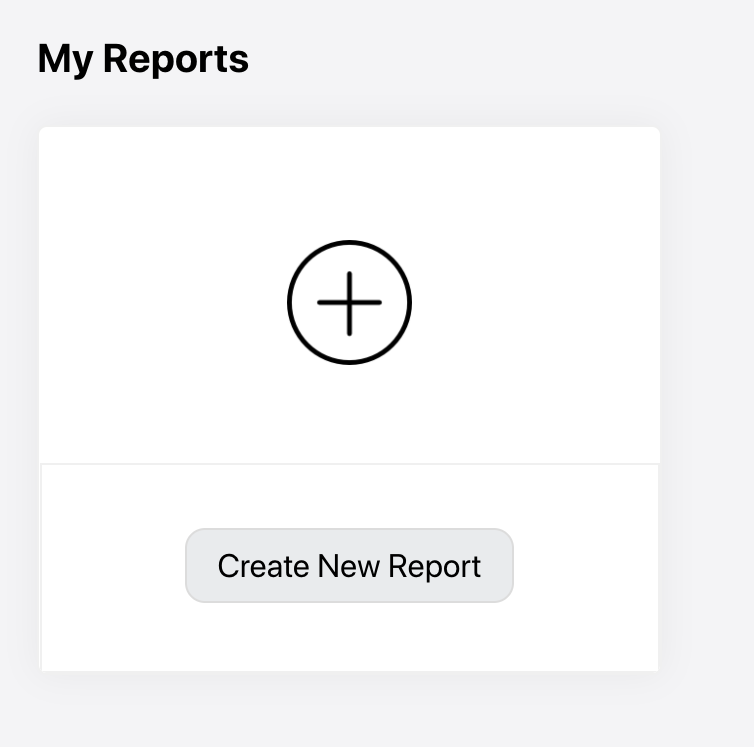
3. On the Report Builder Main Dashboard, click on the Create New Report button.
4. In the report window, you can view different report templates on the left-hand side screen.
5. Each template will have different combination of reports in it. Choose the template that suits you. If not, you can always customize the report based on the different data source and charts you prefer.
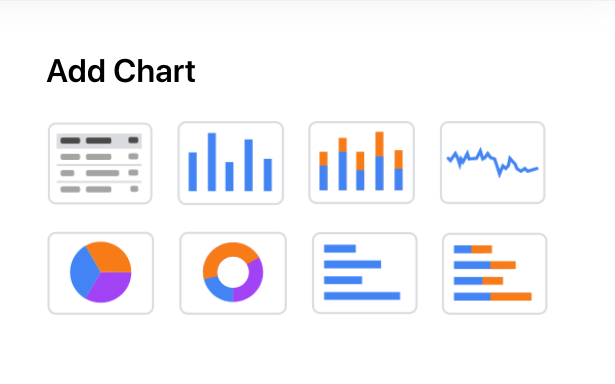
6. On the top right-hand side of the screen, select the type of chart you prefer. You can select more than one chart, as per the image above.
7. For example, you select the pie chart, there will be a drop-down field appear beneath the add chart section. You can view data source, sort on, and the theme color in the drop-down.
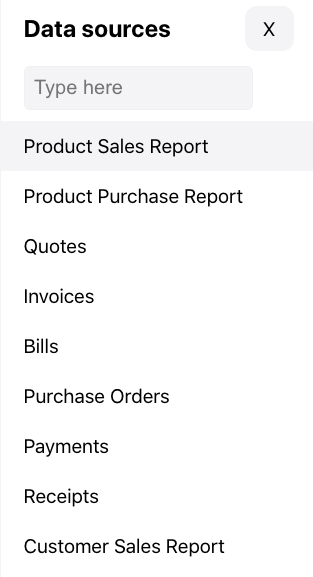
8. Search for your preferred data source from the drop-down options . The data source here is linked to your data in Deskera Books. Selecting the data source here will pull out the respective data from your Deskera Books account.
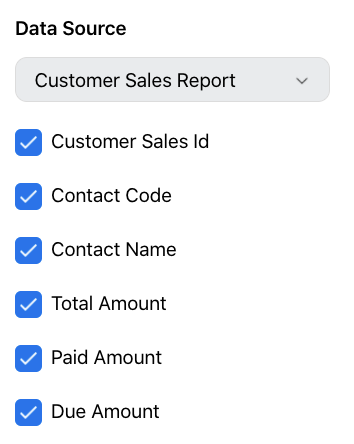
9. Next, enable the checkbox for the fields in the data source.
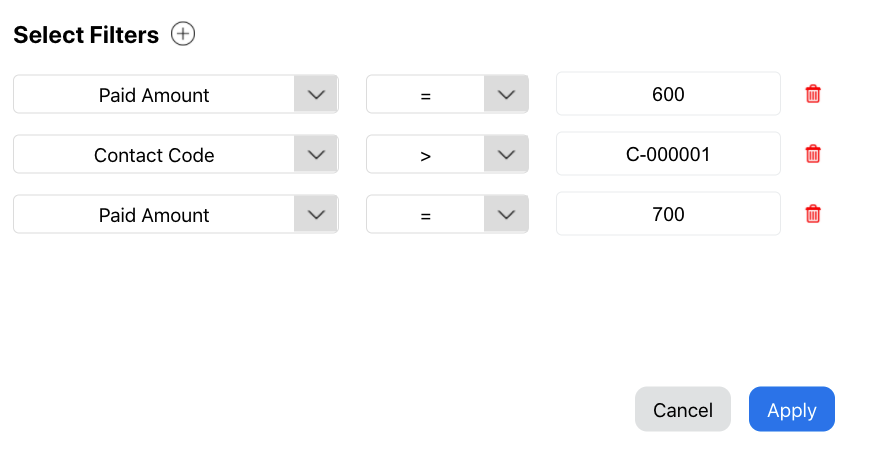
10. Also, you have the option to filter the data based on different criteria. Click on the Add button next to the select filters header. Input the fields, conditions, and values for each filter.
11 Click on the Apply button.
12. Under the sort on section, choose the values; ascending, descending, or default.
13. Click on the Apply Changes button. You can view the charts with the information from your Deskera Books account.
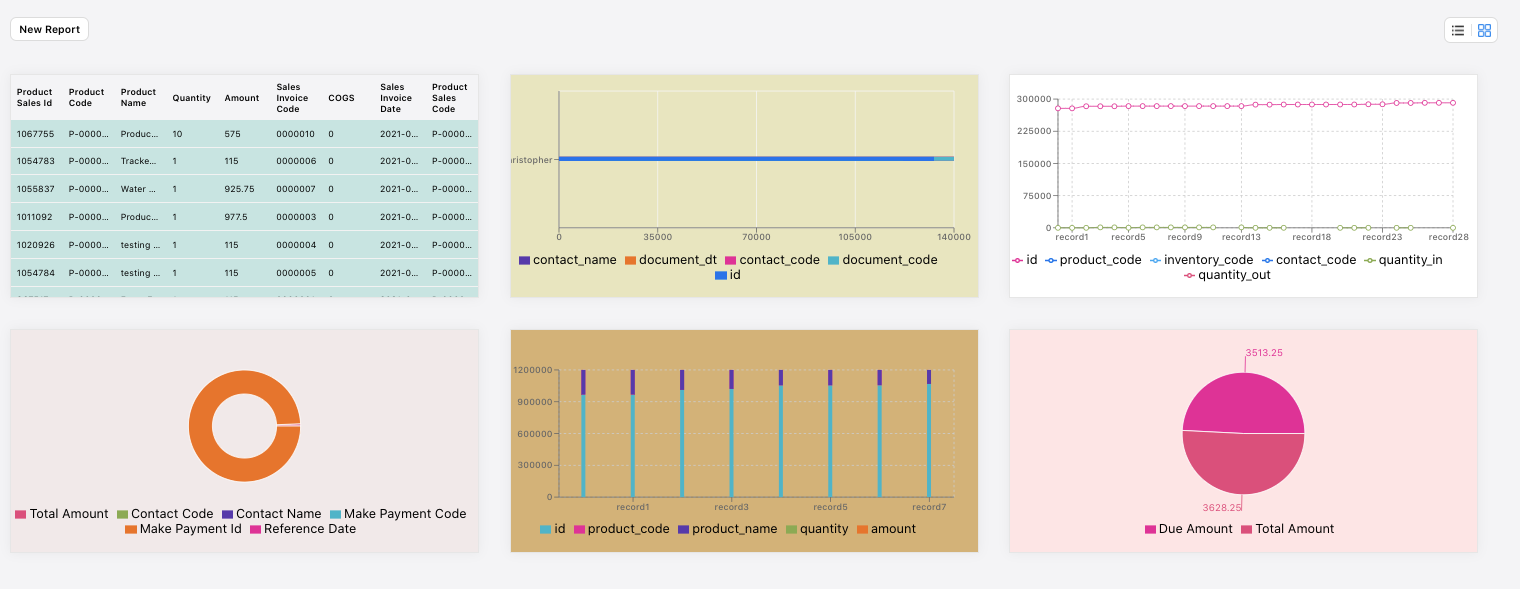
14. You can create different reports using different charts in a single page, as per the image above.
15. Click on the Save button at the top right screen.
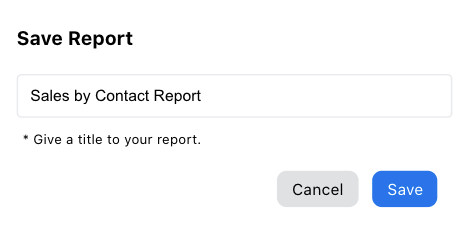
16. Input the report's name and click save.
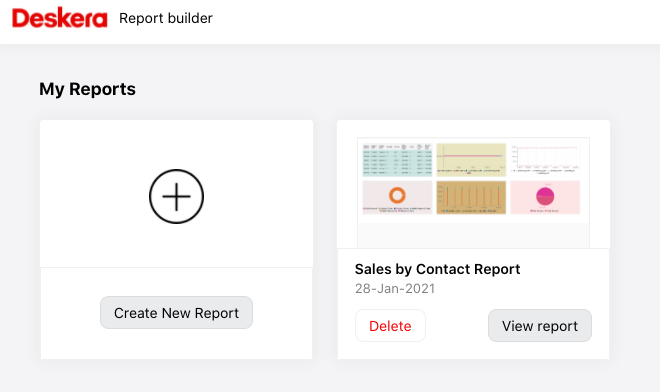
17. On the report builder main dashboard, you can view the report saved.
How can I delete the report?
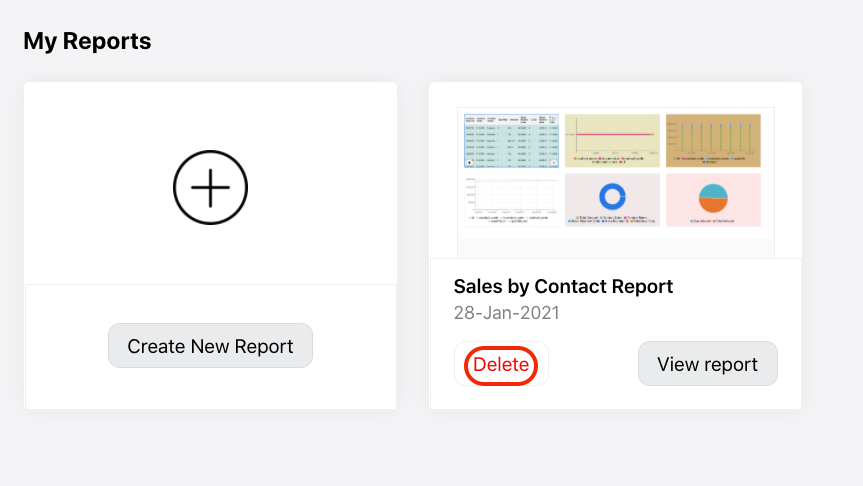
- On the report builder main dashboard, click on the delete button to delete all the reports saved under this folder.
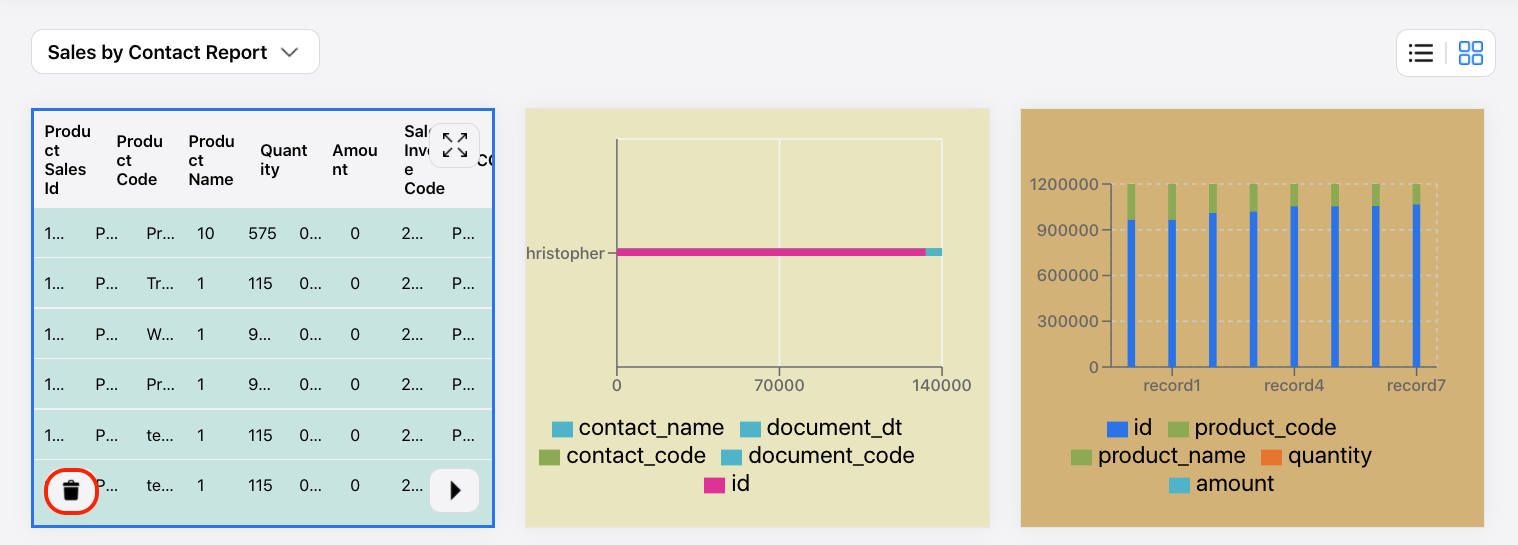
2. To delete the individual report saved in this folder, click on the respective charts and select the bin icon.
3. Click on the left/right arrow on each chart to change the chart's arrangement.
Can I send the report via email?

- At the top panel of the report page, click on the email icon to share the report with other users.

2. Enter the recipient's email and the subject of the email.
3. Click Send.
4. Also, you can download, export, and print out the report.