

If you cannot measure it, you cannot improve it- Lord Kelvin
Has your company been facing a lot of losses lately? Are you unhappy with the growth rate of your company? Or do you simply like to keep tabs on your company’s performance? If so, then it’s time you start tracking your sales metrics!

Sales metrics are data points that indicate how a sales representative, a team, or a company is performing when it comes to sales. Monitoring the sales metrics can mean all the difference if you wish to go up the success ladder. Wondering how?
It is simply because sales metrics help you to set a benchmark for your team’s progress. Moreover, it also majorly helps you to make improvements in your work processes. So, you must keep your eyes on the ball, but the question is which one?
Worry not!
To answer your million dollar question, we have enlisted 15 sales metrics that you must track for your company’s growth. Learn what sales metrics are, which are the ones you must follow as a business owner, the importance of the sales metrics, and a lot more in this article.
This article will cover the following areas:
- What are sales metrics?
- Are sales metrics and KPIs the same thing?
- What is the importance of tracking sales metrics?
- What are the top 15 sales metrics?
- Tips for avoiding sales metrics' challenges.
- How can Deskera assist you?
What are Sales Metrics?
As we have already mentioned a little about sales metrics, sales metrics measure and evaluate a salesperson, sales team, or company’s sales performance. The sales metrics helps an organization analyze the success of its sales initiatives and identify areas that might need improvement.
Sales metrics also inform sales strategies, monitor goals and objectives, and track progress while providing critical business insights. While focusing on the data makes sales reps accountable, it gives managers prime coaching opportunities based on metrics, grounding conversations in data instead of opinion.
Moreover, sales metrics can inform how they are made with sales representatives. It will direct you to structure your sales activities, product/service within the departments.
Hence, all the well-established companies obsessively measure everything about their go-to-market sales model, sales strategy, and salespeople. It sounds a lot like KPIs, doesn’t it? Many businesses often think that sales metrics and KPIs are the same thing, but are they? Let’s find out in the upcoming section of this article.
Are Sales Metrics & KPIs the Same Thing?
No, sales metrics and KPIs are not the same things. While sales metrics and key performance indicators (KPIs) are closely related, they are not synonymous. Sales metrics measure the sales-related performance, activities of a salesperson, team, or company.
On the other hand, a sales KPI is one of the sales metrics used to measure performance against strategic goals. For example, if a business seeks to boost sales by 15%, sales growth is the KPI, and sales revenue is the metric.
“In its simplest form, a KPI is a type of performance measurement that helps you understand how your organization or department is performing” - Ted Jackson.
Now that you have understood the difference between sales metrics and KPIs let us find out what makes sales metrics important to your company.
What is the Importance of Tracking Sales Metrics?
How do you find out if a student is doing well in their school or college? A progress card helps you understand. In that progress card, you have different sections, including participation in cultural activities, awards won progress from last time, student’s contribution to the school, and others.
In businesses, too, for the company’s success, you need to keep a close tab over the sales metrics to see how your employees and the company as a whole are doing. Here are some of the primary reasons why you should track the sales metric.
Improves Employee Performance
Many employees struggle to judge if they're progressing, growing in the company. In most cases, some employees think they are doing well and growing as a salesperson when in reality, they are; after not.
Sales metrics give workers a straightforward scorecard. They let them know if they're progressing in the right direction or not. Take, for instance, a manager responsible for driving more sales in the company with the help of social media platforms and with social media associates in the team; how would they go about it?
It’s simple, with every associate creating a post for social media platform will have to check which post drives the traffic to the company. It helps to understand whether the social media associate has done well or not.
This is why sales metrics help generate a scorecard for the employees that helps them identify what’s working for them and the company’s benefit.
Helps Identify Issues & Loopholes
You cannot manage what you cannot measure. To make improvements in the company and scale as a team, be it sales as a whole, you must be aware of what’s going wrong.
An organization audits results toward the month's end just to acknowledge deals declined. If they had their "war room" and had been following other key measurements, like various leads, they would have seen three weeks sooner that new leads had diminished. They might have fixed the issue before and had substantial deals closed by the end of the month. But unfortunately, since they didn't follow metrics, execution endured incredibly.
It is what you must avoid as a company; after all, prevention is better than cure. You must identify what is not working out in the company. The sales metrics help you identify the problems in the company and allow you to work on new ideas for change that can bear good fruits.
Better Focus
Running a company is always having your plates full. You have multiple things to take care of in a day, but you have only 24hrs, two hands, and one mind. And with this happening constantly, you might lose focus and time both. However, sales metrics can help you change that and put your focus where it needs the most.
Sales metrics will help you identify loopholes in your sales strategies and other areas that need attention. So, as a business owner, you can focus on what needs immediate attention in the company.
By selecting and tracking specific sales metrics, you can ensure your whole company focuses on the right things. Do you want to be known for having the best customer service in your industry? Then track multiple customer service metrics such as returns, response times, and customer satisfaction surveys.
Prevents Further Losses
Running a business is a bumpy ride where you will experience both highs and lows. What you as a business owner can do is, identify the loopholes in your processes. And sales metrics can help you with that.
Considering there are so many interrelated elements that cause the sales, having sales metrics assists you in understanding what’s causing the loss. Once you have studied the sales metrics, you can work on them and make the changes wherever required.
These are some of the compelling reasons that make tracking sales metrics important to your business. Now that you have understood the importance of sales metrics, let us find out which are those 15 sales metrics that you must undoubtedly track.
15 Sales Metrics for Growth
Every company’s nature of business differs from the other, and so do their sales metrics. If one sales metric is critical to a certain company, it might not be the same for the other. There is not a single sales metric critical for all companies, be it within the same industry.
The sales metrics that any company chooses depend on its goals and principles. For instance, if your business’s goal is to have every sales representative meet their desired quotas, metrics that track the percentage of deals per person closes would be a helpful metric to follow.
In another instance, if your organization wishes to land bigger deals, it might track the average deal size to see whether its approach works with big clients.
Note: As businesses grow or branch into new markets, metrics can be added or eliminated.
Here is a list of 15 sales metrics that you must track for the growth of your business:
#1 Average Deal Size
The average deal size or average selling price refers to the average dollar amount of each closed deal.
The formula for Average Selling Price (ASP) calculation:
Average selling price = (total $ of closed deals over a specific time period) / (total # of deals)
Average deal size means, if a company closes three deals in a quarter, at $60,000, $60,000, and $75,000, the average selling price for that quarter would be $65,000 for that quarter.
The average deal size sales metric demonstrates your income groups' capacity to rise in the market and close bigger deals. Is your message reverberating with big the clients? Are your outreach groups ready to oversee complex deals cycles with higher sticker prices?
Average deal size should be tracked by the total business for the given period, monthly, quarterly, or annually. Renewals and new deals break it down to get an understanding of where the most profitable deals lie.
This helps you judge whether you are progressing or your deals are reducing in numbers or stagnant. In order to increase your sales rate, you need your average deal size to increase. If you’re trying to land more SMB customers, you want this number to go down and your overall revenue and number of customers to go up.
Another primary reason average deal size makes for top sales metrics is that it can help you spot potentially risky deals. For instance, imagine one of your sales rep adds an opportunity four times bigger than the usual fashion of deals to the CRM. Now, considering the deal is big in size, the probability of closing it is lower. Moreover, even the sales process for this deal is likely to take longer.
What you can do is, make sure that the other deals in your salesperson's pipeline are near-sure bets and that they’re not putting all of their quota eggs in one deal. Look out for any salespeople whose average deal size is significantly lower than the team’s average.
#2 Annual Recurring Revenue
ARR is an acronym for Annual Recurring Revenue, a key metric used by SaaS or subscription businesses with term subscription agreements, meaning a defined contract length.
ARR is the less frequently used alternative normalization method of the two common ones, ARR and MRR. It is used almost exclusively in B2B subscription businesses.
Annual recurring revenue, or ARR, is the total amount of contracted revenue your company brings in each year. It’s a particularly crucial key performance indicator (KPI) to follow for any especially subscription-based business.
This is because it tells you how much money you can expect to receive from customers in a given fiscal year. When tracked historically, ARR can be used to evaluate a company’s growth and assist in long-term forecasting.
The formula for ARR calculation:
Annual recurring revenue (ARR) = (total value of a contract) / (number of contract years)
Take for instance, for a 2-year annual contract totaling $50,000, the calculation would be $50,000/2 = $25,000. Now add all the ARRs for each contract to calculate the total ARR.
You can look at ARR by region and product to gain insight into the performance of specific solutions or areas in the industry. The same thing applies to the monthly recurring revenue (MRR). This represents the total amount of contracted revenue your sales team expects to bring in each month.
For a license-based approach, an alternative formula can be used if the contract includes variable revenue per year. For example, a $60,000 contract over three years could be $10,000 in year one, $20,000 in year two, and $30,000 in year three.
The formula for variable revenue ARR calculation:
Variable Revenue ARR = Number of Active Licenses that Year x Average Revenue Per User (ARPU)
#3 Sales Conversion Rate
Of course, the sales conversion rate has to be in the top three sales metrics for growth that you must track. Let us understand what the conversion rate sales metric is. The Sales Conversion Rate metric measures the effectiveness of your sales team at converting leads into new customers.
It’s an essential metric for aligning your sales and marketing team, as both teams will use this metric to determine the quality of leads. The process for generating leads is the responsibility of marketing, and that team will engage in lead generation activities.
For example, a marketing team will organize and execute a conference sponsorship in coordination with sales to generate sales-ready prospects.
The formula for conversion rate calculation:
Conversion rate percentage = (# of leads converted into sales/total qualified leads)
Keeping a tap on this sales metric will help you measure how well your sales team turns leads into new customers, and as a result, improve the overall quality of leads.
As you monitor conversion rates over time and the characteristics of those leads, it ensures that your company focuses on selling to buyers relevant to you. And the buyers you can rely on in the longer run.
For all the businesses with longer sales cycles and multiple sales stages, it’s advisable to track the conversion rate between each stage. Take, for instance, how often do the net new leads turn into sales qualified pipeline? Or how often do sales qualified pipelines turn into revenue?
Understanding these conversion metrics at each stage will help you continue to tighten your revenue processes. For example, the historical conversion rate from net new leads to sales qualified pipeline is low.
In this case, you might need to consider fine-tuning your top of sales funnel messaging. You must also improve the instrumentation to bring in a different unit of leads with more specific qualifications.
To understand which sources tend to convert to new customers, which get lost in the process somewhere. What the sales teams can do in this case is, they should track the origin of deals in the sales funnel with conversion rate sales metrics.
#4 Average Revenue Per User
The Average Revenue Per User (ARPU) is the revenue generated on average by each active person. This sales metric is similar to Average Revenue Per Account (ARPA), generally used for SaaS models. The difference is that SaaS models tend to look at this based on an account level, which may have multiple users within one business. In contrast, consumer apps tend to monetize individual users.
The average revenue per user (ARPU) or average revenue per account (ARPA) refers to the amount of money that a company brings in per subscriber, user, or account in a particular time period. It is calculated by dividing the total amount of revenue for that time period by the number of subscribers, customers, or accounts during that period.
The formula for ARPU/ARPA calculation:
ARPU/ARPA = (total amount of revenue in the given time period) / (average number of subscribers during that time period)
Amongst the many sales metrics, this KPI is helpful to track for many reasons. If your ARPU is increasing, it’s an indicator that your revenue is holding value. You may be able to avoid steep discounts just to get customers on a contract or may refrain from scrambling to hit your number by the end of the year.
Identifying your highest ARPU customers may also give you an idea of your best product-market fit. Take, for instance, notice that cyber security and telecommunications firms are your highest ARPU clients.
This will give you a heads up to strengthen those segments because you know they’re willing to pay the price you are asking for without affecting the value of your product.
#5 Pipeline Coverage
Sales pipeline coverage measures the ratio between the dollar value of your funnel and upcoming revenue targets. For example, a three sales pipeline coverage ratio means your total pipeline is three times your quota. In this case, you need to close 33% of the pipeline’s value to meet your sales goal.
Remember, that’s not one-third of all deals. It’s a third of the value of the pipeline. Win deals that are above average size, and you need to close fewer of them successfully.
Alternatively, if your sales pipeline ratio is one or less, you don’t have enough funnel to meet your revenue goal. Not even if you win every deal. Managers often focus on this metric at the start of the year or quarter. They, and the board, want to know whether it’s going to be a successful period. As such, pipeline coverage is top-of-mind for many executives.
To measure this metric, you take your total pipeline for a period and divide it by your quota for that same period.
The formula for pipeline coverage calculation:
Late-stage pipeline coverage = (Stage 2 deals + Pipeline $) / (Forecast $ - Closed $)
For example, if a rep has $500,000 of pipeline for Q2 and their quota for Q2 is $125,000, then their pipeline coverage is $500,000 / $125,000 = 4.0x. This rep has a 4x pipeline coverage.
You often face a few problems calculating the pipeline coverage. The metric takes no account of opportunity stages or the customer buying cycle. For example, an extensive pipeline may contain many early-stage opportunities with a low chance of closing successfully. In this case, a high pipeline coverage ratio risks creating a false sense of confidence.
Hope rather than genuine customer intention or activity exaggerates funnel size. That’s because an emphasis on pipeline coverage means salespeople are under pressure to boost funnel size.
Similarly, the pipeline often contains deals that have slipped from the previous period and have little change in closing successfully. In both cases, your funnel is overstated.
Measuring the total pipeline size ignores many variances between types of opportunities. For example, it’s reasonable to assume a difference in win rates between new and existing customers, business lines, and territories.
There may also be run-rate opportunities for which no current opportunities exist. As such, the pipeline coverage ratio is a very broad-brush number.
#6 Quota Attainment
Quota attainment is an essential sales metric because a declining quota attainment rate can be an indication of deeper problems, such as inadequate rep ramp, coaching, or capacity planning.
In order to measure this metric take the sum of the qualifying amount from opportunities won that have a close date in the period you're measuring. Then divide that by the rep's quota for the same period. Express that number as a percentage to get the rep's quota attainment.
Many companies use spreadsheets to calculate this metric. Sales scorecards can automate quota Attainment calculations so that you can see how a rep is pacing on their quota attainment at any point during the period. You can also see historical percentages for reps over time.
The formula for quota attainment calculation:
Quota attainment = (number of closed deals or revenue in given time period) / (quota for that time period)
This is an important sales forecasting metric to monitor to keep track of how deals have closed against targets and to identify reps who might benefit from more coaching or guidance. Quota attainment percentages might even signal the need for team structure changes if tracked over time.
This number isn’t static throughout the month or quarter, so you should measure it at a consistent cadence during your rep/manager’s one-on-one sales meetings. This will also allow you to track whether your team is moving deals through the sales pipeline consistently throughout the current quarter and next quarter.
#7 Sales Linearity
Sales linearity is defined as when deals close in a predictable pattern on a week-to-week and month-to-month basis throughout the quarter. Instead of deals closing in bulk at the end of the quarter as reps rush to make their number, sales linearity is the practice of setting up and nurturing opportunities in a balanced way to close business regularly throughout the quarter.
Sales linearity isn’t just about closing deals earlier; it affects the entire sales management and sales forecasting process. Deals should be forecasted to close evenly throughout the quarter instead of by the last week or sometimes the last hour of the quarter, and reps need to manage their pipeline properly to ensure opportunities are in the right stage at the right time.
A linear sales process is crucial for improving sales predictability, allowing companies to have firmer control of their fiscal health. A linear sales cycle enables your company to easily predict when onboarding resources will be needed to support new customers.
It helps your company build better cash flow, taking the pressure off of finance and operations to do more with less. You can drive better margins with sales linearity, preventing the need to discount at the end of the quarter.
Creates a predictable revenue stream that fuels growth and other investment decisions throughout the company.
#8 Churn Rate
Customer churn rate is a metric that shows the total percentage of customers who stop doing business with you over a certain period of time. For example, if you have 100 customers and 5 of them leave, your churn rate is 5 percent.
According to Growth Consultant Lincoln Murphy, an acceptable annual churn rate for SaaS companies is 5-7%.
Whether you’re in a B2C or B2B market, the churn rate is a metric that tells you how effectively your organization is maintaining your current clients.
Churn rate is one indicator of how well we’re performing in the marketplace. If we have people canceling subscriptions to our review site, we know we need to dig into our product offerings and figure out why we’re not keeping them. -Phil Strazzulla, Founder & CEO of SelectSoftware
The formula for churn rate calculation:
Churn rate = number of churned customers / total number of customers
A low churn rate indicates high customer satisfaction, which means more revenue for your business in the long run. Because it’s much easier to keep customers than gain new ones, this is what your business needs to have.
A high churn rate is bad for any company, but it can be especially harmful to SaaS companies because they rely heavily on recurring revenue from their customers. When customers leave, revenue dries up quickly, and it’s costly to replace them with new ones.
This leads to a downward spiral where more churn means less cash flow, making it harder to attract new customers and ultimately putting the company on a trajectory to fail.
#9 CRM Score
The CRM Score is one of many predictive analytics sales analytics tools that can help revenue teams identify the likelihood that a deal will close based on previous deals with similar behaviors. It can also help leaders identify if an agreement is at risk and where reps should spend their time.
A deal with a high CRM Score may require less attention than a low one. It’s a critical input for pipeline management. Lead scoring assigns points to people in your CRM based on attributes that make them better leaders.
Higher scores help your sales team determine quality and interest, focus their efforts, and become more efficient. Scoring identifies when individuals show a lot of interest by interacting with your brand.
Lead scoring comes in two basic types:
- Demographic
- Activity-based.
Demographic:
Demographic lead scoring is derived from rules you set up around certain demographic characteristics of a lead. If you’re selling to specific kinds of people, you can increase a contact’s score because they exhibit traits that make them better targets for your products or services.
Activity-Based:
Activity lead scores are based on people taking action. You can give lead points for interacting with your brand in any number of ways. Examples would be:
- Reading or clicking an email
- Visiting a webpage
- Watching a video
- Filling out a form
- Chatting with your support team
- Meeting with a salesperson
With activity lead score decay, you determine how fast those points decrease over time. One common method is using the same math as radioactive half-life calculations.
#10 Sales Productivity Metrics
“When people are crystal-clear about the most important priorities of the organization and the team they work with and prioritize their work around those top priorities, not only are they many times more productive, they also discover they have the time they need to have a whole life.” - Stephen Covey.
Sales productivity is the rate at which your representatives achieve their sales target. The less time it takes for a sales representative to meet the sales target, the higher the sales productivity.
From a high level, sales productivity is similar to how productivity is measured in economics; output (revenue) is measured against each unit of input (reps). Understanding which inputs drive the most output should be the goal of measuring sales productivity metrics.
The sales productivity metrics mainly includes the following:
- Percentage of time selling
- Percentage of time on data entry
- Percentage of time in content creation
- Percentage of marketing collateral for use by sales representatives
- Number of sales tools used
- Percentage of high-quality lead follow-up
A customer relationship management (CRM) tool is the main hub of information on your customers and prospects. The data held within the CRM is the foundation for reports and predictions to make strategic business decisions.
Once the sales information is organized in a CRM, marketing automation accounts for the leads coming into the pipeline. The data from marketing automation platforms can provide a holistic view and deep learning of your sales reports’ and sales prospects’ activities.
Compiling and tracking these sales metrics is much easier with AI in sales and sales tracking tools in place to track the right indicators, review them on an ongoing basis, and address performance weaknesses within your process, pipeline, or team.
Moreover, remember that there are two main indicators for your sales productivity metrics- the leading ones and the lagging ones. Leading indicators predict your results, and while they can be more difficult to measure effectively, they’re easier to change and influence in advance. Activity metrics are an example of lagging indicators.
Lagging indicators are reactive and reflect your results. They’re easier to track but more difficult to influence. Low quota attainment or top-of-the-funnel weakness are examples of lagging indicators.
#11 Net Retention Percentage
Net Revenue Retention (NRR) Rate is the percentage of recurring revenue retained from existing customers in a defined time period, including expansion revenue, downgrades, and cancels.
This churn metric gives a comprehensive view of positive as well as negative changes with respect to customer retention. In a SaaS business, a Net Revenue Retention Rate is a growth indicator.
Across all SaaS companies, the median Net Retention Rate is. Higher Annual Contract Value (ACV) products have higher Net Retention Rates. For SaaS companies selling into small and medium businesses (SMBs), a good Net Retention Rate is 90%. For Enterprise SaaS, 125% is considered a good Net Retention Rate.
In most cases, Net Revenue Retention Rate is tracked monthly or yearly. Although you achieve a fuller picture of retention by tracking both dollar and customer retention, NRR can be a great place to start.
Remember to review your NRR percentage at least on a monthly basis to stay informed of negative and positive! fluctuations and their impact on your revenue.
Retaining customers is key to operating a healthy and profitable business. A high Net Retention Rate (NRR) is an indication that your offering represents a strong value proposition for your customers.
NRR is an indication of how well a company can not only renew but generate additional revenue from its customers following an initial sale, in what’s often referred to as a “land and expand” strategy.
NRR is also an important component of profitability. Acquiring a new customer can be 5 - 25 times more costly than retaining an existing customer. By keeping and expanding your existing customers, you reduce your Customer Acquisition Cost (CAC), increasing your profitability.
A high company growth rate and high NRR are correlated according to SaaS Capital research. Gainsight has also found that mature Customer Success practices are correlated with a higher NRR.
For a comprehensive understanding of retention, it’s important to track both the percentage of all customers who renew or cancel contracts, measured by logo churn and the percentage of all revenue dollars under a contract that renews.
More and more businesses want to keep their current customer bases in an effort to maintain a level of stability. Net retention percentage goes hand in hand with churn rate, but with a slight twist.
The formula for net retention percentage calculation:
Net retention percentage = (Renewal ARR + Upsell ARR - Churn) / (Target Renewal ARR)
This isn’t a static metric; you’ll want visibility into real-time renewal, upsell, and churn forecasts to help your sales and customer success teams achieve customer satisfaction and growth.
#12 Win Rate
Win rate tells you the success rate of your sales team. To increase your reps’ win rate, you need to find where they have the most difficulty converting opportunities from stage to stage. Analyze your sales funnel by stage – are your reps losing a lot of opportunities in the early stages of the late stages?
If conversion rates are low in the early stages, your team will need help with such skills as rapport building, better qualification, or maybe product knowledge and demo skills. And suppose conversion rates are low in the later stages of the sales funnel.
In that case, you may want to start coaching skills such as managing objections, gaining commitment, negotiation skills, or perhaps even closing skills. As a sales leader, you should always be trying to increase your team’s win rate.
It’s not as simple, but through setting a solid sales process, through consistent training, good sales coaching, sales and marketing support, this is possible to increase gradually and over time until a point that it is sufficiently good and steady.
Look at win rate in conjunction with other things such as deal size or lead source. Your win rates can be higher when the original source of the opportunity is from referrals or from inbound marketing .i.e. when the prospect was searching for a solution like yours and found you) rather than from outbound sales .i.e. when your sales development reps cold call them).
Alternatively, your win rate can decrease when your sales reps work on considerably larger opportunities than your average deal size, which you win.
The formula for win rate calculation:
Win rate = total # of won opportunities/total # of closed opportunities (both won and lost)
Analyzing how the win rate changes over time can help you gauge your sales reps’ performance, as well as how much sales pipeline coverage you need to hit your sales targets. Segmenting win rates by product, team, marketing campaign, or other factors can offer insight into each factor’s variations in performance.
The only way to ensure you're improving your win rate over time is to calculate, document, and track your win rates by rep, loss reason, and/or deal stage over time.
Two common measures for sales effectiveness are win rate and pipeline conversion rate. Many confuse or conflate these concepts. “Win rate” has become a generic term used when managers or leaders are looking to quantify a seller or team’s success at closing deals.
Win rate is a suitable metric for that purpose, but its value in predictive analytics and forecasting is limited. Sometimes when a business leader is inquiring about win rate, they really need a pipeline conversion rate.
#13 Sales Cycle Length
Sales cycle length is simply the total number of days it takes for a deal to close, divided by the total number of closed deals. The time period you use to assess sales cycle length may need to align with the way you track revenue.
For example, if you close the books on a quarterly basis, that may be the best parameter to measure sales cycle length. For others, looking at it from a monthly perspective will probably make the most sense.
The number you get won’t necessarily tell you the full picture; there will always be some deals that happen sooner and some that will be prolonged due to unforeseen events.
What this really gives you is a baseline to try and improve your sales processes or coach your reps to get the cycle length as low as possible. Many companies use this metric to measure the overall performance of your sales strategy: the lower the sales cycle length, the better.
On top of measuring the effectiveness of your sales strategy, tracking this KPI can boost your sales cycle. For instance, you can use the sales cycle length to check for leads that are growing cold. If a deal is way behind your company’s average period, you can assign a sales rep to follow up on the lead and extend offers such as a free trial or price discounts.
You can also use this metric to improve your sales cycle by contrasting your company’s average sales cycle against each sales rep’s average sales cycle length. There are two ways to go about this.
First, if a sales rep’s average sales cycle length is shorter than the company’s average sales cycle, that means the person is doing a great job. This can be an opportunity for you to investigate what’s working for the sales rep to share the insights with the rest of the team.
On the other hand, sales reps with longer sales cycle lengths are struggling to keep up. They can be put up for training or one-on-one coaching. Monitor the average sales cycle of your team and your company with the use of a CRM.
The software can quickly generate sales cycle length reports with a few clicks. The reports contain information on the number of days it takes a sales rep to close a deal. This enables you to identify which sales reps need more support.
To measure the sales cycle with you need to run a report of opportunities won in the period you want to measure. Count how many operations that is.
Then, for each operation, calculate the number of days between Created Date and Close Date. Sum up that total number of days. Then divide the number of days by the number of operation you won.
#14 Deal Slippage
Every company has faced this at some or some other point in their business journey. Your sales pipeline was looking great until two weeks before the end of the quarter, then oops! It falls off a cliff!
The deals are still there, marketing is producing leads, the sales team is still celebrating new wins, and the sales funnel looks healthy. But it just happened again, DEAL SLIPPAGE. You might not make the target this quarter. Firstly, we can define slippage to mean when any close date on a deal changes.
When a deal doesn’t close within the expected timeline in the sales forecast, the target date gets pushed further out. The deal hasn’t been completely lost, and the buyer may still show interest, or the sales rep may be overly optimistic about a prospect’s commitment to purchase.
Either way, deal slippage occurs when that once-committed opportunity gets pushed into the next quarter, month, or designated sales period. “Tumbleweed deals” are deals that never seem to close and simply keep moving from one period to the next.
The percentage of deals in the commitment that fails to close within the forecasted period is your slip rate. The truth is, everyone slips deals even if they don’t think they do. The important thing is to be able to identify what your slip rate is so you can properly plan for it.
Knowing your slip rate, along with a few other critical sales forecasting metrics, can mean the difference between on target and a blown quarter. Deal slippage distorts the sales forecast, which can trigger a detrimental domino effect on the business.
Less revenue than expected can negatively impact stockholders and the company’s valuation. In worst-case scenarios, a missed forecast can lead to layoffs or downsizing.
Remember, deals that slip later in the quarter leave your sales team less time to pull deals into band-aid the situation. If deals consistently slip later in the quarter, either identify the root cause of the problem to prevent it or have a solid backup plan on hand that can be turned around in a tight window.
Moreover, if you can track your slip rate and determine how consistent it is quarter after quarter, you can plan for it, work that into your forecast and have a backup plan on standby. If you have a healthy pipeline you can pull from, you should still hit your number before the end of the quarter.
#15 Average Profit Margin
As a business owner, it is utterly mandatory to turn to mathematics and formulas in order to track your financial operations. Categorically, there’s no way in which you can assess whether your business is successful or not without being fully aware of the relationship between the investments made and the revenue generated.
This brings us to another important metric, namely, the average profit margin ratio. It calculates the average profit generated from the sale of a given service, service category, or product. If you’re one of the many companies that sell a wide selection of services or products, this KPI will turn out to be quite useful.
That’s because each service/product usually generates distinct profit margins. It pays off to determine what is most efficient of them, to know what to focus on in the foreseeable future.
There is another way in which you can use this metric, though. For instance, you can compare and contrast distinct profit margins generated by distinct services and products, or generated by sales representatives, or in given locations. As you can see, you can customize the metric depending on what you want to find out.
You may be wondering, what is a good profit margin, though? A good margin will vary considerably by industry, but as a general rule of thumb, a 10% net profit margin is considered average, a 20% margin is considered high (or “good”), and a 5% margin is low. Again, these guidelines vary widely by industry and company size and can be impacted by a variety of other factors.
You must be wondering how the average profit margin is calculated? The average profit margin is calculated by dividing your company’s net income by its net sales.
The formula for average profit margin calculation:
Average profit margin = net income / net sales
To find your net income, subtract your company’s total expenses from the total revenue. Net sales are calculated by subtracting the total returns or refunds from total sales. Average profit margin can also be measured by product, region, and rep to gain insight into how each segment of the business is performing.
These are our top 15 sales metrics for growth that you must track as a business owner today. To help you track your sales metrics efficiently, we have collated a list of tips to improve your sales metrics monitoring process.
Tips for Avoiding Sales Metrics Challenges
Missing the right metrics poses a significant risk to business decision-making processes. Decisions made in the absence of data or wrong data can result in cost overruns, schedule slippages, quality issues, dissatisfied customers, and canceled projects. With the right metrics and an efficient analysis framework, you will only do justice to your business.
Avoid Unrealistic Targets
Many organizations set targets without any thought to current performance, process stability, or process capability. Industry benchmarks are helpful, but before applying these benchmarks to an organization, the team should analyze current process performance to ensure that unrealistic targets are not set.
Unrealistic targets create resistance within an organization and impact team and people performance. In some cases, they also lead to data manipulation or incorrect reporting. Before setting any targets, the metrics team should ensure that processes are stable and that process capability can be measured in a reliable manner. Process capability should be measured from the customer’s perspective.
Don’t Overload The Metrics & Reports
Many organizations generate a lot of metrics and reports that nobody uses. Sometimes, it is even difficult to track who is actually the owner of what is being reported. All reported metrics should be critical to the business, not simply ones suggested by best practices or textbooks.
Efforts should be made to identify a small and balanced set of metrics that meets the organization’s needs and are cost-effective to maintain and run. All existing metrics should be assessed with key stakeholders to understand the relevance and importance of each. Redundant metrics should be discarded.
Pick Your Metrics Wisely
This is an important one. As you know, there are a lot of sales metrics, but you must be wise while choosing the ones for your company and sales teams. Any metric that cannot be tied to an organization’s goals and objectives needs to be discarded unless there is a compelling reason for that metric, such as a specific request from a customer.
After this evaluation, a team may find that it lacks metrics that link to the organization’s goals and objectives, in which case, the team must decide on the right metrics. If the organization’s goals and objectives cannot be quantified, they should be reassessed; otherwise, the team will not track progress toward the objectives.
Metrics Analysis
Companies that generate metrics reports also should have a robust metrics analysis framework. Without a statistical framework for measuring, analyzing, and improving process performance, the value of metrics diminishes. Metrics and reports are a means to an end, not the end themselves. They should be analyzed to assess process stability and capability and to trigger process improvements efforts.
Teams also should ensure that reported metrics data is accurate. Verification and validation of data are of paramount importance as incorrect data will lead to incorrect conclusions.
A robust metrics analysis framework will enable the identification of root causes if processes do not go as planned and data-based corrective actions are needed. Another bonus tip that we have for you is using Deskera for the growth of your business—wondering what makes it so special? Find out in the next section.
How Can Deskera Assist You?
Deskera is an all-in-one software that can be accessed across all devices and places. When it comes to sales, two of its software- Deskera CRM and Deskera CRM+ are designed and equipped with features that will help your business with sales.
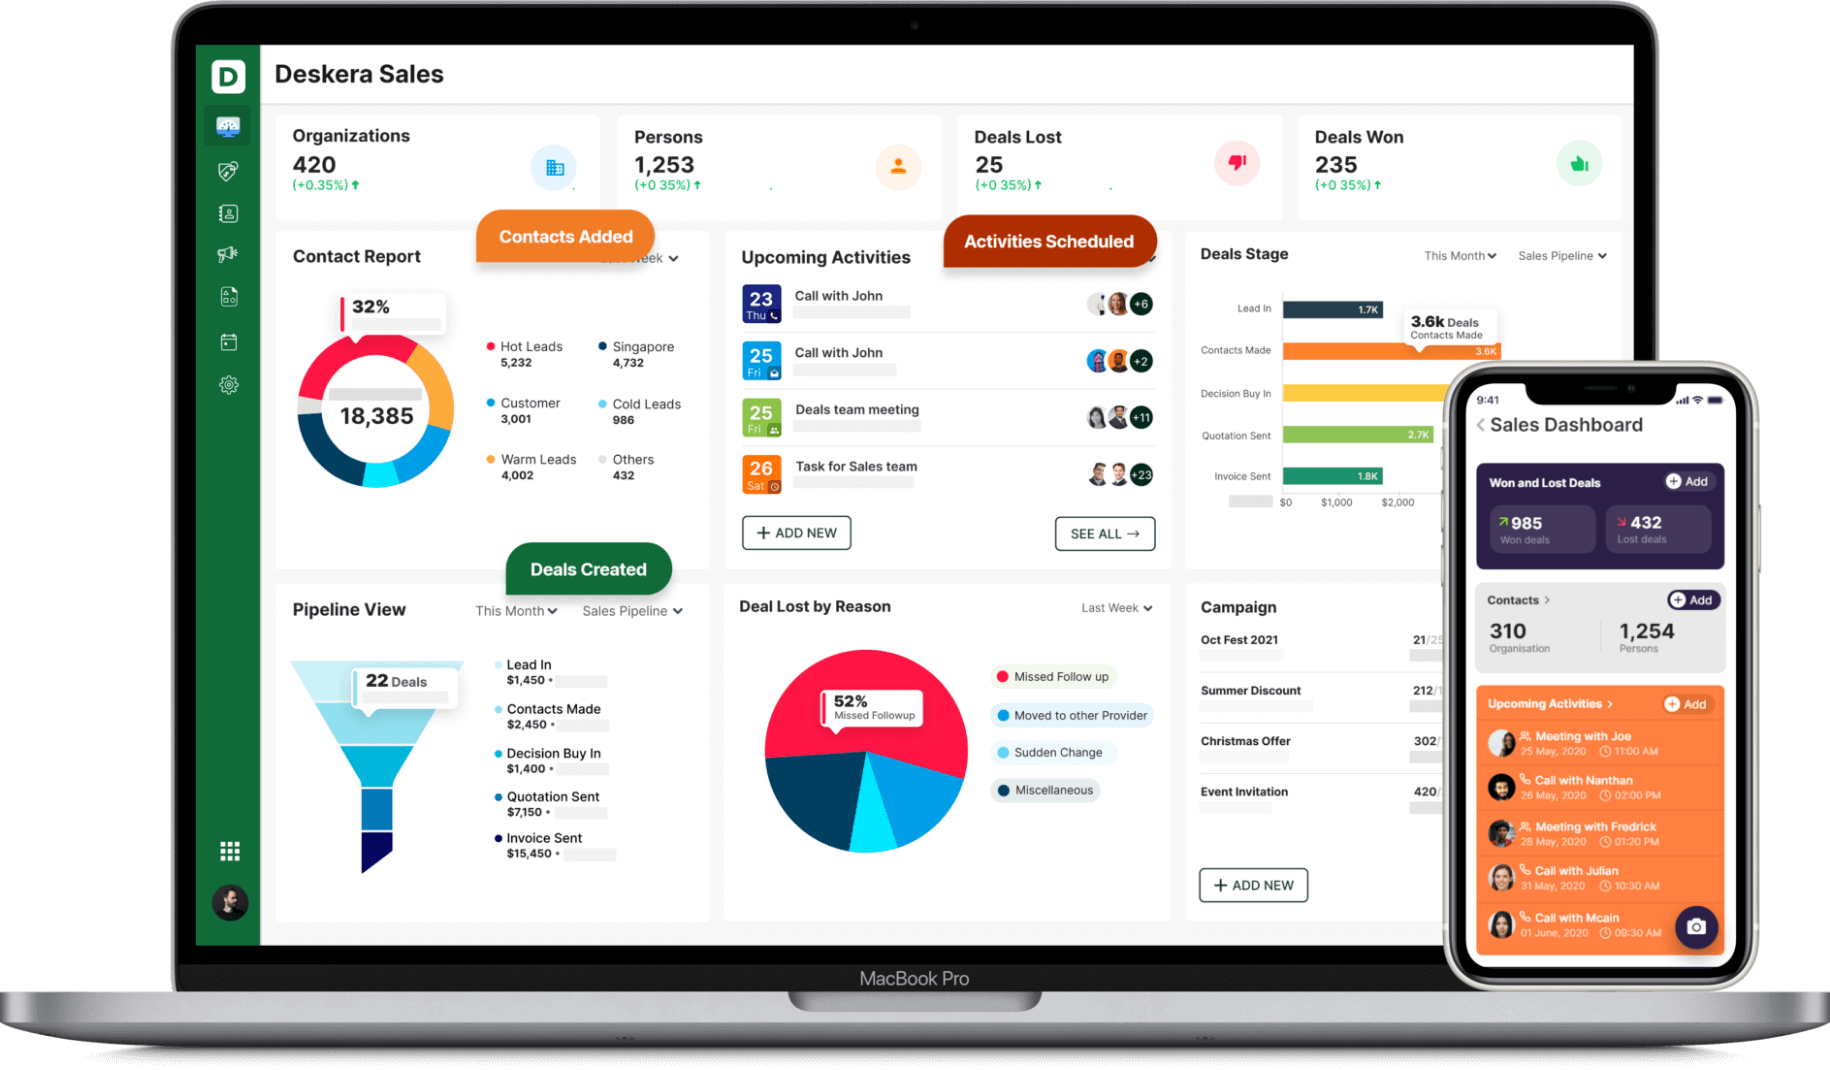
The sales dashboard of Deskera CRM will help in setting up the sales leaderboard that gets updated in real-time. Additionally, the different KPIs and metrics tracked by both the software will give them insights into how to close deals, contact the customers and get more sales. To do this in an organized way, Deskera CRM+ allows the creation of unlimited sales funnels, landing pages, forms, and segmentation of leads.
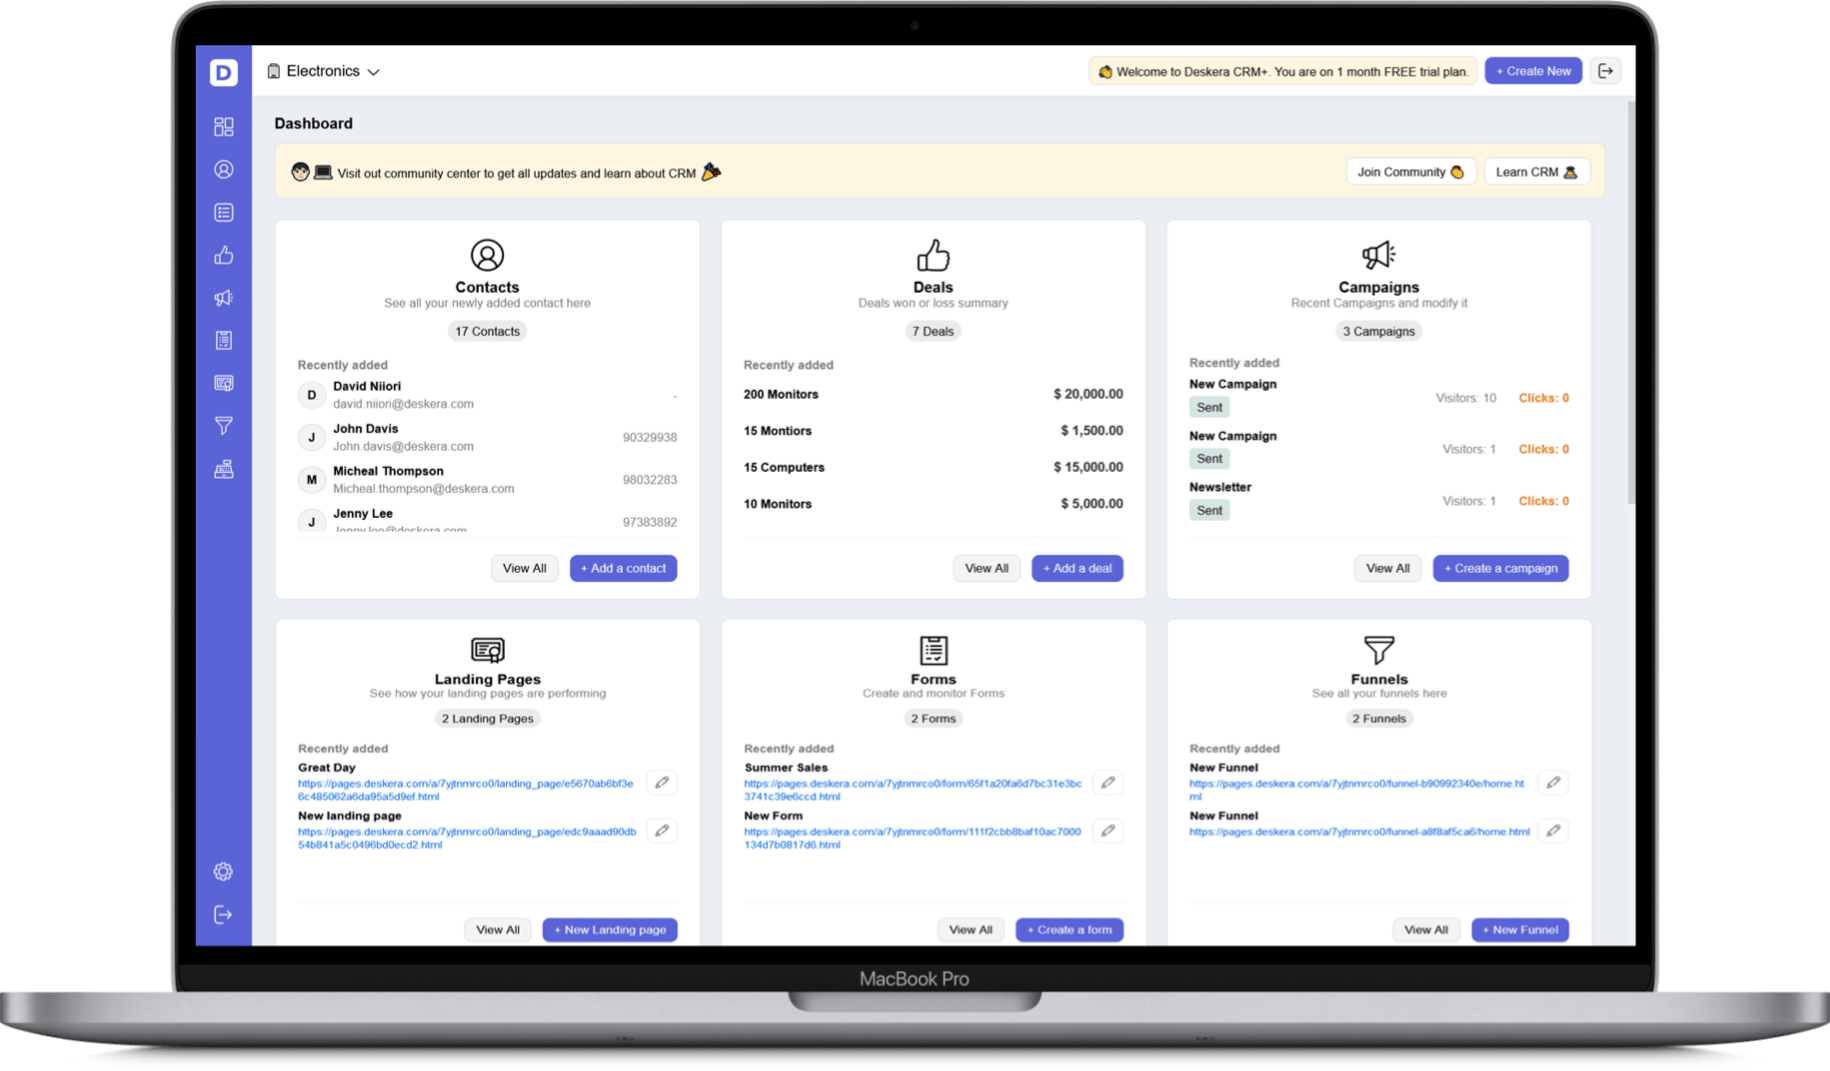
It also has high-performing templates available for the same- that you can either use directly or edit and use, or you can even make your own design from scratch. One of the highlights of this feature is that whichever template you use for your landing pages they are automatically optimized for the phone as well as tablet view along with the web view.
In fact, you can even build your own lead magnets, product pages, registration pages, opt-in pages, and more to give your marketing the boost it needs.
Deskera CRM tracks and analyzes the performance of open and click-through rates. It updates the deals and insights in real-time. This helps to find out which sales process is working the best along with different marketing strategies like performance marketing, content marketing, social media marketing, etc.
Key Takeaways
- Sales metrics are data points that indicate how a sales representative, a team, or a company is performing when it comes to sales.
- To make improvements in the company and scale as a team, be it sales as a whole, you must be aware of what’s going wrong.
- Considering there are so many interrelated elements that cause the sales, having sales metrics assists you in understanding what’s causing the loss.
- The average deal size or average selling price refers to the average dollar amount of each closed deal.
- Sales metrics give workers a straightforward scorecard. They let them know if they're progressing in the right direction or not.
- Annual recurring revenue, or ARR, is the total amount of contracted revenue your company brings in each year.
- A low churn rate indicates high customer satisfaction, which means more revenue for your business in the long run.
- Win rate tells you the success rate of your sales team.
- As a business owner, it is utterly mandatory to turn to mathematics and formulas in order to track your financial operations.
- Many organizations set targets without any thought to current performance, process stability, or process capability.
- Companies that generate metrics reports also should have a robust metrics analysis framework.
- Analyzing how the win rate changes over time can help you gauge your sales reps’ performance, as well as how much sales pipeline coverage you need to hit your sales targets.
- Many organizations generate a lot of metrics and reports that nobody uses.
- Sometimes, it is even difficult to track who is actually the owner of what is being reported.
Related Articles