
The Consumer Packaged Goods (CPG) industry is undergoing a transformative shift, driven by evolving consumer preferences, rapid digitization, and fierce competition. As brands battle for shelf space—both physical and digital—the ability to make timely, data-driven decisions is becoming a key differentiator. Understanding what drives business performance is no longer optional; it’s essential for long-term survival and profitability.
According to recent market data, the global CPG industry is projected to reach a staggering $18.94 trillion by 2031, growing at a compound annual growth rate (CAGR) of 5.1% from 2022 to 2031. In 2024 alone, the industry is expected to add $3.18 trillion in value, with the United States contributing a substantial $821 billion. This explosive growth signals immense opportunity—but only for those brands that can measure and act on the right performance indicators.
To navigate this fast-paced environment, tracking the right Key Performance Indicators (KPIs) has never been more important. From sales velocity and trade promotion ROI to on-shelf availability and digital engagement, the right metrics help CPG companies stay agile, customer-centric, and growth-focused. Brands that consistently monitor and optimize these KPIs position themselves to lead—not just survive—the next wave of market evolution.
Tools like Deskera ERP play a pivotal role in helping CPG businesses centralize their operations and monitor key metrics in real-time. With features for inventory management, sales tracking, demand forecasting, and financial reporting, Deskera empowers businesses to turn insights into action. Whether you're scaling a legacy brand or launching a new product line, Deskera offers the agility and intelligence required to compete in today’s data-driven CPG landscape.
What Are CPG KPIs?
CPG KPIs, or Consumer Packaged Goods Key Performance Indicators, are measurable benchmarks that CPG brands use to track and evaluate the performance of critical business areas—such as financial health, supply chain efficiency, inventory management, sales success, and marketing execution. These KPIs help brands make informed decisions to improve revenue, cut costs, boost customer satisfaction, and refine go-to-market strategies.
Key CPG KPIs include total revenue, category share, net profit margin, and stock rotation rate. For example, total revenue reflects the gross income earned over a specific quarter, while category share evaluates how a brand stacks up against others in the same product segment. These types of KPIs are classified as tangible—based on hard data. In contrast, intangible KPIs like brand sentiment or product perception often rely on softer metrics such as customer interviews, NPS scores, or social listening data.
It’s important that KPIs are directly aligned with a brand’s strategic goals. For instance, if a company aims to increase its regional market share from 28% to 33% this fiscal year, its KPI framework should measure progress against that benchmark, adjust tactics as needed, and ensure team accountability. Some metrics offer quick snapshots, while others—like customer lifetime value (CLV) or return on promotional investment (ROPI)—reveal deeper insights through multi-layered analysis and trend tracking.
Ultimately, the value of CPG KPIs lies in their ability to connect data with decision-making. Whether the goal is to expand brand presence, reduce time-to-shelf, or increase basket size among loyal shoppers, KPIs ensure efforts are quantifiable, targeted, and agile. CPG brands that routinely define, refine, and act on the right KPIs are best positioned to outperform competitors in a fast-moving marketplace.
Importance of CPG KPIs
In today’s hypercompetitive and rapidly evolving consumer goods market, data is no longer a luxury—it’s a necessity. The sheer scale and complexity of operations across manufacturing, distribution, marketing, and sales make it imperative for CPG brands to rely on measurable, reliable indicators of success. That’s where Consumer Packaged Goods (CPG) KPIs come into play.
These key performance indicators serve as a compass, guiding brands toward their goals and providing a clear picture of what’s working and what’s not. Whether you're trying to boost profitability, streamline your supply chain, or launch a new product, KPIs help translate high-level strategies into actionable business outcomes. When tracked consistently, they don’t just measure performance—they shape it.
Here are the core reasons why CPG KPIs are essential for driving growth and sustainability:
1. Drive Smarter, Data-Led Decisions
CPG KPIs eliminate guesswork by providing concrete data on what’s happening in your business. Metrics like sales per channel, customer acquisition cost, and category market share allow teams to make informed decisions about pricing, promotion, and product placement. By using data instead of intuition, CPG leaders can react faster and more accurately to shifting consumer behaviors and market dynamics.
2. Expose Inefficiencies and Unlock Opportunities
From bottlenecks in the supply chain to underperforming SKUs, KPIs help identify exactly where resources are being wasted or underutilized. For example, a low on-shelf availability (OSA) rate may point to distribution issues, while high days inventory outstanding (DIO) could indicate overstocking. With visibility into these inefficiencies, companies can proactively course-correct and uncover untapped revenue opportunities.
3. Align Goals Across Departments
Effective CPG KPIs create alignment between different teams—finance, sales, marketing, and supply chain. Everyone works toward the same benchmarks, reducing internal silos and ensuring coordinated execution. If the objective is to grow market share by 6% in the next two quarters, then teams can break down how each function contributes to that outcome, track performance regularly, and adjust strategies in sync.
4. Maximize Return on Marketing and Trade Spend
With KPIs like Return on Advertising Spend (ROAS), Trade Promotion Effectiveness (TPE), and Customer Acquisition Cost (CAC), brands can analyze how well their marketing and promotional budgets are performing. These insights help fine-tune messaging, optimize channel selection, and increase the impact of every dollar spent—especially important when operating in crowded or price-sensitive markets.
5. Leverage Technology for Real-Time Monitoring
Modern tools like Deskera ERP allow CPG businesses to automate KPI tracking across all departments. By integrating data from sales, inventory, accounting, and customer management, Deskera offers real-time dashboards that help leadership stay updated on performance, benchmark results against industry norms, and forecast with precision. This eliminates manual errors and enables faster, more accurate reporting and decision-making.
6. Improve Brand Development and Market Positioning
CPG KPIs related to brand health—such as aided brand recall, Net Promoter Score (NPS), and share of voice—help marketers assess how their brand is perceived in the market. These insights support better packaging design, messaging strategies, and positioning campaigns. KPIs also help identify consumer preferences and trends, allowing for more targeted product innovation and personalization efforts.
7. Support Long-Term Planning and Scalability
Tracking KPIs over time provides invaluable historical data for forecasting future trends. Metrics like customer retention rate, average order value (AOV), and gross margin return on investment (GMROI) help businesses project future growth, anticipate demand spikes, and scale their operations efficiently. This is especially important for brands expanding into new regions or diversifying their product portfolio.
By integrating CPG KPIs into everyday operations and long-term planning, brands can not only monitor progress—they can steer it. These indicators empower teams to stay focused, agile, and aligned with overarching business goals, ultimately laying the foundation for sustainable growth and market leadership.
Types of CPG KPIs
To effectively navigate the complex landscape of consumer packaged goods, CPG companies rely on a wide range of KPIs—each offering unique insights into specific areas of business performance.
These KPIs can be broadly categorized into five core groups based on their functions and strategic relevance:
1. Sales and Revenue Metrics
These KPIs track how well products are performing in the market and help assess financial success and growth potential.
- Gross Sales: Represents total sales revenue before deductions like discounts, allowances, or returns. It’s a high-level indicator of sales volume across channels or product lines.
- Net Sales: Calculated after subtracting marketing expenses, production costs, and returns. It offers a more accurate view of profitability and product viability.
- Market Share: Reflects the percentage of total industry sales captured by the company, showing how well a brand performs relative to competitors.
- Units Sold: Tracks the quantity of products sold during a specific period, useful for identifying best-sellers and forecasting demand.
- Order Backlog: Measures the volume of orders not yet fulfilled—a leading indicator of future revenue and production needs.
2. Marketing and Brand Metrics
These KPIs evaluate the effectiveness of campaigns and promotional activities, offering insights into brand visibility, acquisition, and return on investment.
- Customer Acquisition Cost (CAC): The total cost of acquiring a new customer, including marketing and sales expenses. Lower CAC generally indicates higher campaign efficiency.
- Return on Advertising Spend (ROAS): Measures the revenue generated for every dollar spent on advertising. A high ROAS indicates effective marketing investments.
- Brand Awareness: Tracks consumer recognition and recall of the brand, often measured through surveys, impressions, or social media reach.
- Trade Spend Efficiency: Evaluates the ROI of trade promotions such as discounts, coupons, and in-store activations.
- Share of Voice (SOV): Indicates the brand's visibility in advertising or online channels compared to competitors, reflecting competitive positioning.
3. Supply Chain and Distribution Metrics
These metrics ensure products move efficiently from production to the consumer, and help companies optimize inventory, logistics, and vendor relationships.
- On-Time Delivery (OTD): Measures the percentage of orders delivered by the promised date—key for customer satisfaction and operational efficiency.
- Inventory Turnover: Indicates how frequently inventory is sold and replenished in a given timeframe. A higher rate often reflects efficient stock management.
- Perfect Order Fulfillment: Tracks the percentage of orders delivered without errors—right product, time, condition, and documentation.
- Distribution Rate: Assesses the speed and coverage of product delivery to retailers. High distribution rates indicate strong supply chain performance.
- Retailer Adherence: Measures compliance with planograms, promotional execution, and pricing strategies. It ensures retail partners align with brand expectations.
- Out-of-Stock Rate: The percentage of time a product is unavailable when a customer is ready to buy. Lower rates improve customer satisfaction and sales continuity.
- On-Shelf Availability: The duration and consistency with which a product is physically available on retail shelves.
4. Inventory and Operational Metrics
These KPIs focus on internal processes, helping CPG manufacturers maintain lean operations and avoid costly overstocking or stockouts.
- Sell-Through Rate: Percentage of inventory sold compared to what was available, often used to assess product demand and merchandising effectiveness.
- Cash Conversion Cycle (CCC): Time taken from purchasing inventory to collecting revenue from sales. A shorter CCC indicates better liquidity and cash flow management.
- Inventory Accuracy: Compares system records against actual physical stock. High accuracy reduces discrepancies and improves supply chain reliability.
- Warehouse Utilization: Tracks how effectively storage space is being used, helping reduce carrying costs and improve logistics efficiency.
5. Customer and Loyalty Metrics
Understanding customer satisfaction and loyalty is vital for sustaining long-term growth and improving retention rates in the CPG sector.
- Customer Satisfaction (CSAT): A direct measure of customer happiness, typically obtained through post-purchase surveys.
- Customer Lifetime Value (CLTV): Estimates the total revenue a customer will generate during their relationship with the brand. A high CLTV suggests strong loyalty and effective retention strategies.
- Customer Retention Rate: The percentage of customers who continue to buy a product or remain engaged with the brand over time.
- Customer Loyalty: Monitors behaviors like repeat purchases, brand advocacy, and participation in loyalty programs.
- Net Promoter Score (NPS): Assesses customer willingness to recommend the brand or product to others. It’s a widely-used indicator of customer loyalty and brand health.
Why Categorizing KPIs Matters
Segmenting KPIs into these specific types helps CPG companies:
- Focus on what matters most for each function—sales, marketing, logistics, or customer experience.
- Set clear goals and benchmarks for teams across departments.
- Identify and address bottlenecks in specific areas without losing sight of the big picture.
- Enhance cross-functional collaboration through data transparency.
From supply chain logistics to shopper sentiment, the right mix of CPG KPIs empowers businesses to fine-tune their operations, drive innovation, and grow market share—efficiently and sustainably.
How to Set CPG KPIs
Setting key performance indicators (KPIs) for consumer packaged goods (CPG) businesses is essential for tracking performance, improving efficiency, and driving strategic decisions.
Here’s a step-by-step guide to establishing impactful KPIs based on CPG data:
1. Define Your Business Objectives
Start by identifying the core objectives that your KPIs should support. These can include:
- Increasing market share
- Improving customer satisfaction
- Optimizing supply chain operations
- Boosting profitability
- Enhancing product availability
Each KPI should tie directly to a strategic priority.
Example: If your goal is to improve customer satisfaction, KPIs like Net Promoter Score (NPS) or Customer Satisfaction Score (CSAT) become relevant.
2. Align KPIs With Departmental Goals
Translate high-level business objectives into department-specific goals to create focused KPIs. Ensure alignment across teams:
- Sales team: Focus on units sold, market share, and order backlog
- Marketing team: Track brand awareness, ROAS, and customer acquisition cost
- Operations: Monitor inventory turnover and on-time delivery
- Customer service: Measure NPS, CSAT, and retention rate
Tip: Ensure each KPI contributes directly or indirectly to your overall business objectives.
3. Identify the Right Metrics
Select KPIs based on:
- Relevance to objectives
- Actionability: The metric should guide clear decisions
- Availability of data: Ensure data can be tracked consistently and accurately
- Time-bound nature: Track performance over a defined time period
Example: To track trade performance, metrics like trade spend ROI and store-level sales are ideal.
4. Set Realistic and Measurable Targets
Establish baselines using historical data and industry benchmarks, then set SMART targets (Specific, Measurable, Achievable, Relevant, and Time-bound). Avoid setting goals that are either too easy or unattainable.
Example: If your current inventory turnover rate is 5x annually, a realistic goal might be to increase it to 6x over the next two quarters.
5. Establish Data Sources and Tools
Ensure you have access to reliable tools and platforms to collect, analyze, and visualize KPI data. These may include:
- ERP systems
- CRM software
- Trade promotion management tools
- POS data from retailers
- Market research platforms
Recommendation: Use dashboards for real-time tracking and alerts.
6. Assign Ownership and Accountability
Each KPI should have a clear owner responsible for tracking, reporting, and taking action. Ownership ensures accountability and drives results.
Example: The marketing manager may be responsible for improving ROAS by optimizing campaigns.
7. Monitor and Review Regularly
Track progress on a weekly, monthly, or quarterly basis depending on the KPI. Hold review meetings to:
- Analyze performance trends
- Identify bottlenecks
- Adjust strategies as needed
Tip: Use leading indicators (like customer complaints) to predict lagging outcomes (like churn).
8. Refine and Evolve Your KPIs
Business environments change rapidly—especially in the CPG sector. Periodically reassess your KPIs:
- Are they still aligned with company goals?
- Are any metrics outdated?
- Are new data sources available?
Example: With growing ecommerce sales, you might add digital shelf metrics or e-retail availability scores.
Setting CPG KPIs is a dynamic process that begins with clear objectives and ends with data-driven decisions. The right KPIs help CPG brands gain visibility into every aspect of their operations—from supply chain logistics to customer engagement—empowering them to grow strategically and sustainably.
Benefits of Tracking KPIs in the CPG Industry
Tracking KPIs allows CPG businesses to move from guesswork to precision. With real-time and historical data, they can navigate supply chain volatility, shifting consumer behavior, and evolving market dynamics.
Here’s a deep dive into how KPI tracking supports long-term value creation:
1. Improved Decision-Making
KPI tracking empowers CPG leaders with reliable, data-backed insights to guide business strategy. Rather than reacting to problems, companies can anticipate them.
Key Benefits:
- Real-time visibility into sales trends, promotional effectiveness, and customer behavior.
- Ability to forecast outcomes using historical patterns (e.g., seasonality).
- Faster pivots in product mix, pricing, and distribution based on performance signals.
Example: If the sell-through rate drops below 50% for a specific SKU across retail locations, the sales team can investigate whether poor shelf placement or ineffective promotions are the cause and take targeted action.
2. Enhanced Profitability
Profitability is a complex outcome influenced by product performance, cost management, and marketing effectiveness. KPIs help uncover exactly where revenue is gained—or lost.
Metrics that Drive This:
- Gross margin: Tracks profit per unit sold.
- Operating margin: Reflects efficiency across all operational costs.
- Trade spend ROI: Evaluates returns on rebates, discounts, and promotional costs.
Example: If a product has strong sales but poor margins due to high promotional costs, KPI analysis may suggest reducing discounts or renegotiating retailer terms to maintain profitability.
3. Optimized Inventory Management
CPG companies face the constant challenge of balancing inventory levels with demand fluctuations. KPIs help ensure the right products are available, in the right quantities, at the right time.
Inventory-Related KPIs:
- Inventory turnover ratio: Measures how quickly inventory is sold and replaced.
- Sell-through rate: Evaluates how much inventory is sold versus what was delivered.
- Days of inventory on hand (DOH): Assesses stock longevity.
Benefits:
- Reduce carrying costs and excess stock.
- Avoid stockouts and lost sales.
- Improve warehouse space utilization and replenishment timing.
Example: High DOH indicates that certain SKUs are not moving fast enough. This may lead to markdowns or promotional pushes to clear excess stock.
4. Better Demand Forecasting
Accurate forecasting depends on timely access to consumption trends, channel performance, and sales velocity. KPIs reduce guesswork and enhance planning precision.
Key Metrics:
- Point-of-sale (POS) data: Tracks real-time consumer sales.
- Historical sales trends: Helps model future demand curves.
- Market penetration rate: Measures brand adoption in target markets.
Benefits:
- Align production with true demand.
- Reduce waste from overproduction.
- Enable responsive planning during seasonal peaks or unexpected surges.
Example: A beverage brand tracking weekly sell-through data may notice a spike in demand during hot weather. They can increase production of summer flavors to meet the anticipated rise.
5. Increased Supply Chain Efficiency
Supply chain performance directly impacts delivery times, cost efficiency, and customer satisfaction. KPIs illuminate inefficiencies and suggest areas for streamlining.
Relevant KPIs:
Improvements Gained:
- Reduce delays and disruptions
- Minimize transportation and warehousing costs
- Strengthen supplier collaboration and accountability
Example: If on-time delivery rate drops below 90%, it may indicate problems with warehouse fulfillment or transportation delays. These insights help guide operational adjustments or supplier renegotiations.
6. Higher Customer Satisfaction
Customers expect consistent product availability, accurate delivery, and positive brand experiences. KPIs help companies meet—and exceed—these expectations.
Customer-Centric KPIs:
- Order accuracy rate
- Return rate
- Customer satisfaction score (CSAT)
- On-shelf availability
Benefits:
- Build loyalty through reliability and trust.
- Reduce returns and refunds, improving margins.
- Deliver consistent brand experiences across touchpoints.
Example: Tracking order accuracy can help identify if specific warehouse locations are making packing errors, leading to poor customer experiences.
7. Stronger Trade Spend Management
CPG brands often spend up to 25% of gross sales on trade promotions. Without precise tracking, much of this investment can be wasted.
Trade KPIs:
- Trade spend ratio: Trade spend as a percentage of gross revenue.
- Promotion ROI: Incremental revenue generated from promotional activities.
- Lift-over-base: Percentage increase in sales during a promotion.
Benefits:
- Prioritize high-performing promotions.
- Eliminate low-ROI activities.
- Enable accurate promotion planning and budgeting.
Example: A shampoo brand finds that buy-one-get-one-free promotions yield better incremental sales than percentage discounts, and reallocates budget accordingly.
8. Improved Cash Flow
Strong cash flow is essential for funding operations and growth initiatives. KPIs enable companies to manage receivables, payables, and liquidity more strategically.
Cash Flow KPIs:
- Days sales outstanding (DSO)
- Cash conversion cycle (CCC)
- Inventory-to-sales ratio
Impact:
- Reduce liquidity risk during market volatility.
- Improve working capital management.
- Make more accurate runway projections.
Example: By monitoring DSO, a company can identify which retail partners are delaying payments and take steps to enforce payment terms or renegotiate contracts.
9. Competitive Advantage
Benchmarking internal KPIs against industry standards reveals where a company stands in the market. These insights guide differentiation strategies.
Tactical Benefits:
- Understand market share dynamics.
- Benchmark cost structures and profitability.
- Track category performance against competitors.
Example: If your operating margin is significantly lower than the industry average, this may point to inefficiencies in your supply chain or pricing strategy that need correction.
10. Regulatory Compliance and Reporting
Compliance in the CPG industry is critical, particularly in labeling, safety, and sustainability. KPIs help track compliance activities and reduce regulatory risk.
Compliance KPIs:
- Label accuracy rate
- Time to compliance
- Product recall rate
- Sustainability compliance index
Outcomes:
- Avoid regulatory penalties and recalls.
- Ensure accurate and timely labeling and packaging.
- Maintain consumer trust through transparent practices.
Example: A food brand tracking label accuracy rate can spot frequent mislabeling issues from a specific co-packer and switch to a more reliable partner.
Tracking KPIs isn’t just about measuring performance—it’s about transforming performance. CPG businesses that prioritize the right metrics gain deeper visibility, faster response times, and stronger alignment across departments. These insights support everything from long-term strategic planning to daily operational excellence.
Top 15 KPIs for CPG Brands in 2025
With so many KPIs available today, CPG brands often face analysis paralysis—getting lost in a sea of metrics without actionable insights.
To drive profitable growth, streamline operations, and enhance customer loyalty in 2025, CPG companies must focus on a select group of high-impact KPIs.
These metrics stand out as critical indicators of financial performance, supply chain efficiency, and long-term brand success.
I. Financial Performance KPIs
1. Cost of Goods Sold (COGS)
Why it matters: COGS represents the direct costs tied to production—such as raw materials, labor, and factory overhead. For CPG businesses, tracking COGS is foundational to pricing strategy, margin analysis, and profitability assessments.
Strategic tip: Advanced ERP systems help streamline cost allocations, especially when managing large product portfolios or complex supply chains.
Formula:
COGS = (Beginning Inventory + Purchases) – Ending Inventory
2. Gross Profit Margin
Why it matters: This profitability metric shows how efficiently a company turns revenue into profit before accounting for operational expenses. It's a key input in evaluating pricing power and cost control.
Use case: CPG brands use it to monitor margin erosion, compare SKUs or categories, and identify optimization opportunities.
Formula:
Gross Margin (%) = [(Sales Revenue – COGS) / Sales Revenue] × 100
3. Trade Spend ROI
Why it matters: Trade promotions can consume 20–25% of gross sales in the CPG sector. Tracking ROI ensures promotional spend delivers incremental profits rather than just volume spikes.
Use case: Apply this KPI to assess promotional effectiveness across retailers or geographies and redirect investment to high-performing channels.
Formula:
Trade Spend ROI = (Incremental Profit – Trade Spend) / Trade Spend
4. Days Sales Outstanding (DSO)
Why it matters: DSO shows how quickly a CPG company collects receivables from its retail partners. High DSO can choke cash flow—especially when dealing with large national chains that negotiate extended payment terms.
Strategic tip: Monitor DSO alongside Days Payable Outstanding (DPO) to optimize the cash conversion cycle.
Formula:
DSO = (Average AR / Credit Sales) × Number of Days in Period
II. Operational Efficiency KPIs
5. Inventory Turnover Ratio
Why it matters: This KPI measures how quickly inventory is sold and replaced. In a category prone to spoilage and seasonality, low turnover can lead to obsolescence and waste.
Use case: Combine with demand forecasting tools to plan procurement cycles more effectively and reduce holding costs.
Formula:
Inventory Turnover = COGS / Average Inventory Value
6. Sell-Through Rate
Why it matters: Sell-through offers visibility into retail performance and consumer demand. High rates reflect strong product-market fit, while low rates may signal pricing issues or poor in-store visibility.
Use case: Brands use this to adjust production plans and optimize SKU rationalization efforts.
Formula:
Sell-Through (%) = (Units Sold / Units Received) × 100
7. Days Inventory Outstanding (DIO)
Why it matters: DIO reflects the average time inventory is held before being sold. For fast-moving consumer goods, a lower DIO indicates lean, responsive inventory management.
Use case: Monitoring DIO helps balance service levels with working capital constraints.
Formula:
DIO = (Average Inventory / COGS) × Number of Days in Period
8. Cash Conversion Cycle (CCC)
Why it matters: The CCC ties together DSO, DIO, and DPO to illustrate how long a business’s cash is tied up in its operations. For CPG companies facing fluctuating demand or long lead times, CCC is essential for liquidity planning.
Formula:
CCC = (DIO + DSO) – DPO
9. Product Availability Rate
Why it matters: This KPI measures how often products are available for sale at retail locations, especially when stockouts directly lead to lost sales. A low product availability rate can affect brand reputation and retailer relationships.
Use case: CPG brands track this metric to ensure strong inventory practices are in place, optimizing stock levels, and reducing out-of-stock situations.
Formula:
Product Availability Rate = (Units Available for Sale / Total Units Ordered) × 100
III. Customer-Centric Performance KPIs
10. Customer Retention Rate (CRR)
Why it matters: In saturated markets, retaining loyal customers is more cost-effective than acquiring new ones. High CRR signals strong brand loyalty, satisfaction, and consistent product quality.
Use case: Combine with Net Promoter Score (NPS) or customer satisfaction surveys for a 360° view of brand health.
Formula:
CRR = [(Customers at End – Customers Acquired) / Customers at Start] × 100
11. On-Time In-Full (OTIF) Delivery Rate
Why it matters: Retailers increasingly penalize suppliers for missed delivery windows or incomplete shipments. OTIF reflects how well your operations align with retailer expectations and service-level agreements.
Use case: OTIF is critical in evaluating 3PL performance and improving forecasting accuracy.
Formula:
OTIF (%) = (OTIF Orders / Total Orders) × 100
12. Customer Lifetime Value (CLV)
Why it matters: CLV measures the total revenue a customer generates for a business during their relationship. It provides a holistic view of the long-term profitability of customer relationships and helps brands make informed decisions about marketing and customer service investments.
Use case: CPG brands use CLV to segment high-value customers and tailor retention strategies, such as loyalty programs, personalized marketing, and cross-selling.
Formula:
CLV = Average Purchase Value × Purchase Frequency × Customer Lifespan
13. Social Media Engagement Rate
Why it matters: Social media engagement reflects customer interest and brand loyalty on digital platforms. Engagement includes likes, comments, shares, and other interactions. For CPG companies, strong engagement often translates into higher brand awareness and loyalty.
Use case: CPG brands use this KPI to assess the effectiveness of digital marketing campaigns, influencer collaborations, and community-building initiatives.
Formula:
Social Media Engagement Rate = (Total Engagements / Total Followers) × 100
IV. Market and Sales Performance KPIs
14. Forecast Accuracy
Why it matters: Accurate demand forecasting is critical in the CPG industry to minimize stockouts or overstocking, particularly when dealing with seasonal products or perishable goods. Poor forecasting can disrupt the supply chain and impact customer satisfaction.
Use case: Measure the accuracy of demand forecasts against actual sales to fine-tune production and procurement strategies.
Formula:
Forecast Accuracy = (1 - (|Forecasted Demand – Actual Demand| / Actual Demand)) × 100
15. Market Penetration Rate
Why it matters: Market penetration measures the extent to which a brand’s products have reached their target market. It provides insight into how well a product is performing within specific geographic areas, customer segments, or retail channels.
Use case: This KPI helps brands identify areas with the greatest potential for growth, whether it be new regions, customer demographics, or channels like e-commerce.
Formula:
Market Penetration Rate = (Total Sales / Total Addressable Market) × 100
Bonus KPIs to Watch in 2025
While the top 10 are mission-critical, other KPIs provide supporting insight and should not be ignored:
- Market Share: Measures relative performance against competitors; essential for strategy and pricing decisions.
- Total Sales by Channel/Product: Provides directional insight into what’s working and where to invest further.
- Return Rate: Helps flag product quality or satisfaction issues early—critical for brand equity and reducing costs associated with returns.
Challenges in Measuring CPG KPIs – With Solutions
Tracking KPIs in the Consumer Packaged Goods (CPG) sector is vital—but operational complexity, fragmented data, and evolving trends often compromise reliability.
Below are the most common challenges along with practical solutions CPG companies can implement to enhance KPI tracking and decision-making:
1. Data Integrity and Accuracy Issues
Challenges:
- Manual data entry and paper-based tracking introduce human error.
- Inconsistent standards across locations and departments.
- Outdated benchmarks skew performance insights.
Solutions:
- Implement barcode/RFID scanning for automated data collection.
- Standardize data entry processes and formats across departments and retail partners.
- Use cloud-based systems to centralize data and ensure real-time accuracy.
- Regularly audit data and update KPI benchmarks to reflect current realities.
2. Lack of Real-Time Visibility
Challenges:
- KPI reports are often based on data that's days or weeks old.
- Delayed insight leads to missed opportunities or poor decisions.
Solutions:
- Integrate IoT sensors and real-time dashboards to track KPIs continuously.
- Leverage cloud-based ERP and inventory management systems for instant access to sales, stock, and logistics data.
- Use mobile apps for field teams and store managers to update data in real time.
3. Supply Chain Complexity
Challenges:
- Multiple partners in the value chain complicate data aggregation.
- Inventory tracking suffers from visibility gaps.
Solutions:
- Adopt supply chain visibility platforms that connect all stakeholders.
- Implement collaborative planning systems to synchronize forecasts and inventory.
- Use AI/ML tools for predictive analytics that improve supply chain coordination.
4. Fragmented Systems and Data Silos
Challenges:
- Teams operate on isolated tools, limiting unified reporting.
- KPIs become unreliable due to inconsistent inputs.
Solutions:
- Consolidate data with an integrated Business Intelligence (BI) platform.
- Invest in a centralized ERP system that connects sales, marketing, finance, and operations.
- Ensure system interoperability with API connectors for smooth data sharing.
5. Retailer and Distributor Variability
Challenges:
- Retailers use different formats and update frequencies.
- Misunderstood terms can distort revenue KPIs.
Solutions:
- Standardize data reporting agreements with partners as part of SLAs.
- Use Electronic Data Interchange (EDI) for consistent, automated data exchange.
- Train teams to interpret distributor contracts correctly and automate revenue recognition.
6. Trade Spend Measurement Challenges
Challenges:
- Difficult to link trade promotions to sales uplift.
- Misreported trade spend inflates profitability KPIs.
Solutions:
- Use Trade Promotion Management (TPM) tools to track spending and ROI.
- Attribute trade spend using advanced analytics that link promotions to time-bound sales data.
- Integrate TPM with CRM and POS systems to measure effectiveness at the store level.
7. Adapting to Evolving Consumer Trends
Challenges:
- Consumer behavior changes rapidly (e.g., shift to DTC or sustainability demands).
- Traditional KPIs may no longer apply.
Solutions:
- Implement flexible KPI frameworks that allow for the addition of new metrics.
- Use social listening and market analytics to capture emerging trends.
- Track new KPIs like online conversion rate, carbon footprint per unit, or delivery performance for e-commerce.
8. Regulatory and Compliance Hurdles
Challenges:
- Changing rules require new tracking and reporting.
- Risk of non-compliance if KPIs don’t reflect updated standards.
Solutions:
- Automate compliance tracking through integrated regulatory management tools.
- Regularly review KPIs against current regulations and industry standards.
- Maintain digital audit trails and version control for all performance data.
9. SKU Proliferation
Challenges:
- Managing diverse products with different KPIs is resource-intensive.
- One-size-fits-all KPIs don't reflect SKU-specific performance.
Solutions:
- Segment products and assign tailored KPIs to each SKU category.
- Use product lifecycle management tools to track SKU-level performance from launch to phase-out.
- Automate KPI generation based on product attributes and categories.
10. Technology Integration Challenges
Challenges:
- Legacy systems don’t support modern analytics.
- Disconnected tools result in slow and error-prone reporting.
Solutions:
- Migrate to cloud-native platforms with open architecture.
- Adopt middleware to integrate older systems with new tools.
- Prioritize scalable, modular software solutions to future-proof operations.
How to Monitor and Analyze CPG KPIs
Defining KPIs is only the beginning—effective performance management in the Consumer Packaged Goods (CPG) industry requires continuous tracking, analysis, and adaptation.
Here's a step-by-step approach to monitoring and extracting actionable insights from your CPG KPIs:
1. Leverage Advanced Data Analytics Tools
Why it matters: Manual tracking is slow, error-prone, and often outdated. Modern analytics tools enable real-time visibility into sales, marketing, inventory, and consumer behavior.
Best practices:
- Use platforms like Google Analytics, Power BI, Tableau, or Looker to visualize and track performance across eCommerce and retail channels.
- Deploy Retail Analytics Solutions to integrate POS, trade promotions, and customer loyalty data.
- Adopt predictive analytics to anticipate trends and guide strategic decisions (e.g., forecast demand, optimize pricing).
2. Automate KPI Tracking Across Systems
Why it matters: Disconnected systems and manual reporting lead to inconsistencies and delays in performance evaluation.
Best practices:
- Integrate ERP, CRM, POS, and supply chain tools to create a unified data pipeline.
- Use dashboard tools to auto-update and visualize KPI changes in real time.
- Establish data validation rules and alerts for abnormal KPI fluctuations.
3. Regularly Review and Update Metrics
Why it matters: The CPG landscape evolves quickly—consumer preferences, regulatory requirements, and channel performance shift frequently. Stale KPIs lead to irrelevant insights.
Best practices:
- Review KPI performance monthly or quarterly, depending on the metric and market volatility.
- Replace or refine underperforming or outdated KPIs.
- Involve cross-functional teams (sales, finance, operations, marketing) in review meetings to ensure holistic insights.
4. Benchmark Against Industry Standards
Why it matters: Context is key. Tracking KPIs in isolation doesn’t show how your business compares to peers or the industry.
Best practices:
- Use third-party benchmarks from NielsenIQ, IRI, or Statista to assess how your KPIs perform against industry averages.
- Identify competitive gaps and set realistic performance targets based on the market leaders.
- Monitor competitor launches, pricing strategies, and consumer reviews as part of your benchmarking process.
5. Drill Down for Root Cause Analysis
Why it matters: High-level KPIs can mask underlying issues or missed opportunities. Root cause analysis uncovers what’s really driving performance.
Best practices:
- Break down metrics by SKU, region, channel, or customer segment.
- Use cohort analysis, funnel tracking, and customer journey mapping to go deeper.
- Combine qualitative feedback (e.g., surveys, reviews) with quantitative metrics to form a full picture.
6. Translate Data Into Actionable Insights
Why it matters: Data alone isn’t valuable unless it informs better decisions and strategies.
Best practices:
- Build KPI-driven action plans (e.g., if inventory turnover is low, consider adjusting reorder points or promotions).
- Highlight key insights in weekly or monthly performance reports.
- Use dashboards to flag underperformance early and trigger interventions.
7. Encourage a KPI-Driven Culture
Why it matters: Effective KPI monitoring requires buy-in across the organization, not just the analytics team.
Best practices:
- Make KPIs visible to relevant stakeholders through role-based dashboards.
- Train teams on interpreting data and making decisions based on performance metrics.
- Recognize departments or individuals who achieve or exceed KPI targets to promote accountability.
How Deskera ERP Supports CPG KPI Monitoring and Business Performance
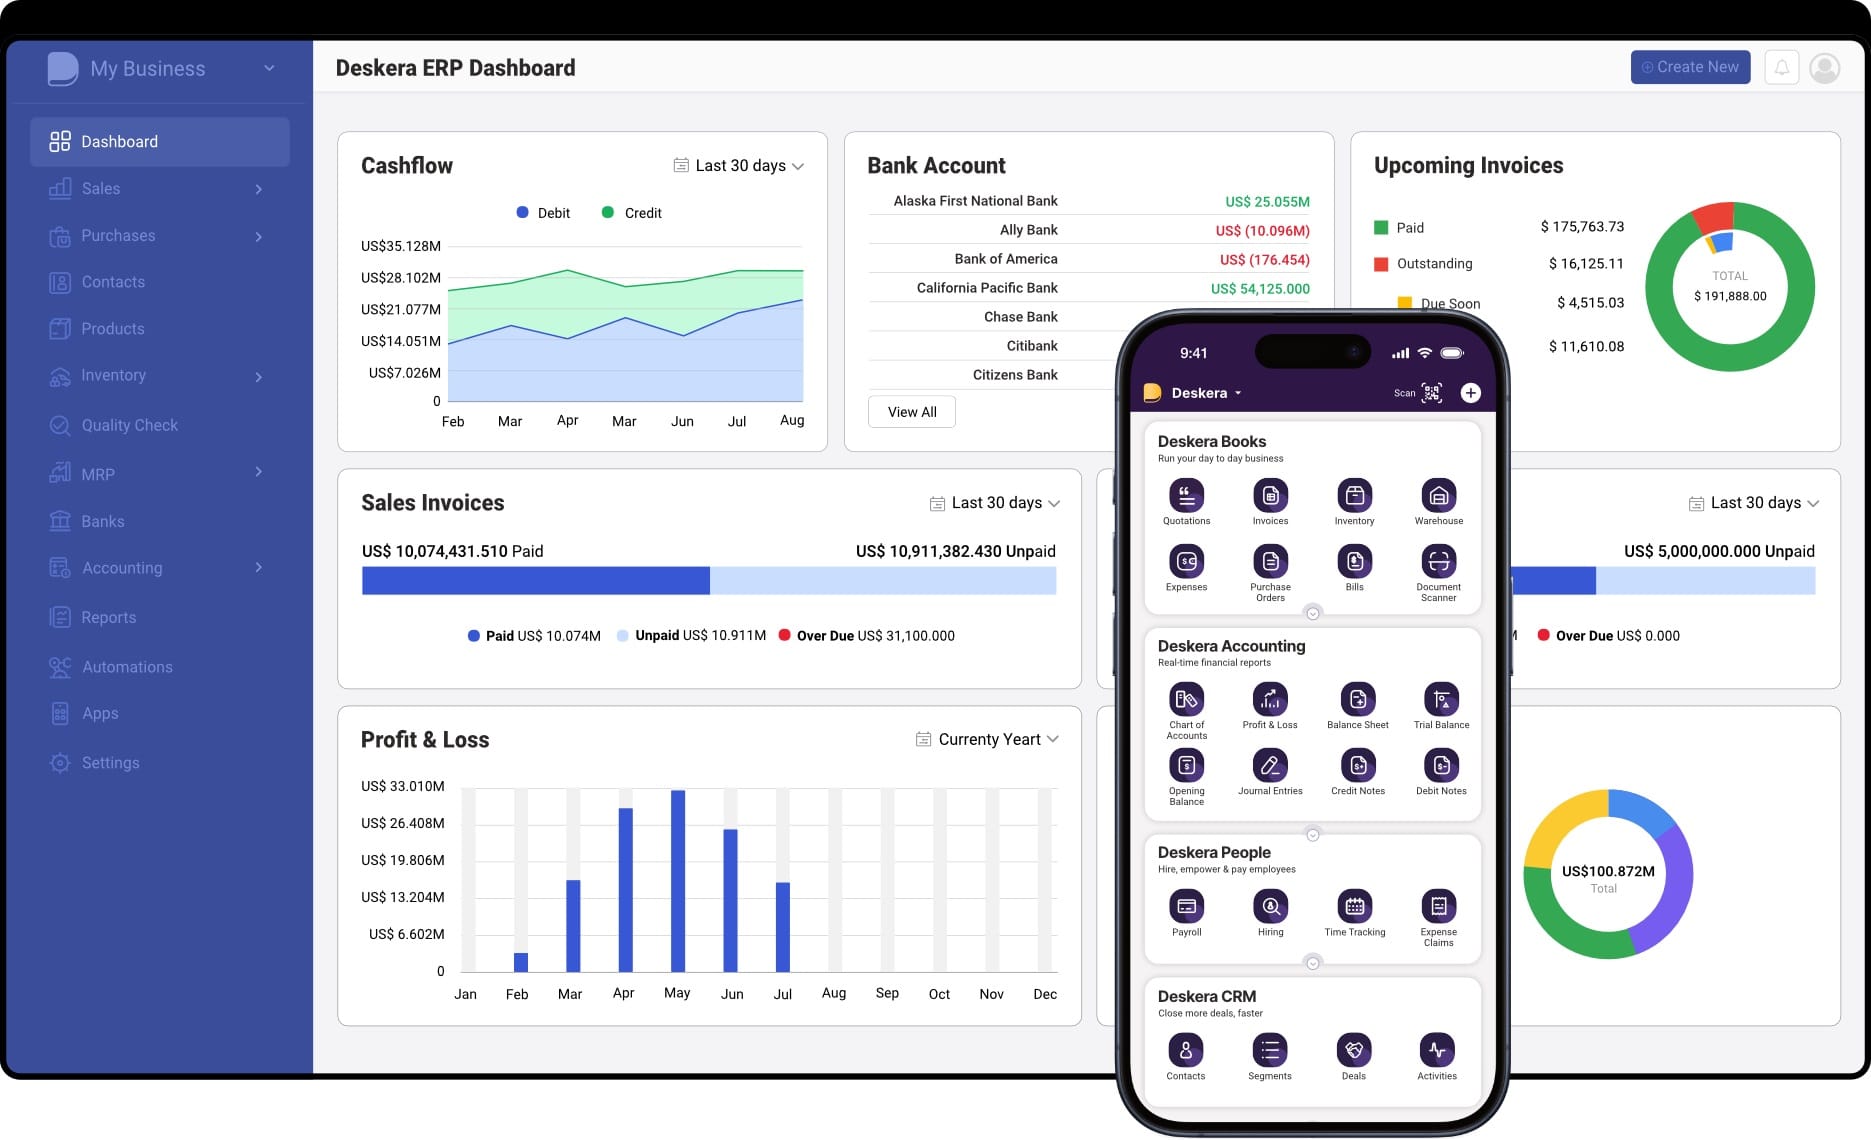
Deskera ERP offers an integrated and cloud-based platform tailored for growing businesses—including those in the Consumer Packaged Goods (CPG) sector. It simplifies the complex task of tracking KPIs by connecting various business functions into one seamless system.
1. Centralized Real-Time Data
Deskera provides a unified platform that consolidates data from inventory, sales, finance, and production. This centralization eliminates data silos and improves the accuracy of KPI measurements—such as inventory turnover, gross margin return on investment (GMROI), and product availability rate.
2. Automated Inventory and Supply Chain Tracking
With built-in inventory management and MRP features, Deskera helps CPG brands track inventory movement, monitor stock levels, and avoid stockouts. Real-time visibility enables accurate tracking of KPIs like on-time delivery rate and fill rate.
3. Advanced Financial and Trade Spend Reporting
Deskera’s accounting module lets CPG companies track revenue, manage expenses, and allocate trade spend accurately. This supports precise calculation of profitability KPIs like net revenue per SKU and ROI on promotions.
4. Customizable Dashboards and Reports
Deskera allows you to build custom dashboards to monitor specific KPIs relevant to your CPG operations. You can visualize performance metrics across SKUs, channels, or regions, enabling faster and more informed decision-making.
5. AI-Powered Insights with Assistant David
Deskera’s AI assistant, David, helps users ask questions about their business performance in natural language and receive instant insights. This makes it easier for non-technical users to access and understand KPI data without needing to dig through spreadsheets.
6. Mobile Accessibility for On-the-Go Monitoring
Deskera’s mobile-friendly interface lets managers and field reps monitor KPIs and business health in real time, even while on the move. This supports agile decision-making in fast-paced CPG environments.
7. Seamless Integration Across Functions
Whether it's procurement, sales, CRM, or HR, Deskera ERP integrates every business function, reducing manual effort and improving the timeliness of KPI tracking across departments.
Deskera ERP equips CPG companies with the tools they need to monitor KPIs in real time, generate actionable insights, and enhance operational efficiency. With its intuitive interface, mobile access, and powerful automation, it turns data into decisions that drive sustainable growth.
Key Takeaways
- Tracking KPIs helps CPG companies align cross-functional goals, stay competitive, and make data-driven decisions in a dynamic market.
- Monitoring sales performance metrics like Net Revenue, Gross Margin, and Sales per Outlet reveals product and channel profitability.
- Metrics like Brand Awareness, ROI on Promotions, and Customer Acquisition Cost (CAC) guide marketing spend efficiency and brand penetration.
- KPIs such as Fill Rate, Inventory Turnover, and Stockout Rate help maintain optimal inventory levels and avoid revenue loss due to supply chain inefficiencies.
- Measuring Product Availability Rate, On-Shelf Availability, and Sell-Through Rate helps brands strengthen retail execution and improve shelf performance.
- Financial metrics like Trade Spend Ratio and Net Profit Margin offer insights into profitability and operational cost control.
- Product Availability Rate helps minimize stockouts and ensure product presence across retail locations, supporting brand loyalty and retailer trust.
- Common obstacles include data fragmentation, lack of real-time visibility, manual processes, and evolving market conditions, all of which can undermine KPI accuracy.
- Implementing centralized data systems, automation, real-time tracking tools, and aligning with external partners can significantly enhance KPI reliability and timeliness.
- Using advanced analytics tools, regularly reviewing metrics, and benchmarking against industry standards ensures KPIs stay relevant and actionable.
- Deskera ERP streamlines KPI tracking with real-time dashboards, inventory automation, mobile access, and AI-powered insights—making it easier to manage and analyze critical business metrics.
Related Articles
 Niti Samani
 Niti Samani
 Niti Samani
 Niti Samani
 Niti Samani
 Niti Samani