

Are you a manufacturing leader looking to enhance your inventory forecasting capabilities and drive operational efficiency? Effective inventory forecasting is a critical component of successful manufacturing operations, allowing companies to optimize inventory levels, minimize costs, and meet customer demands.
But with so many tools and techniques available, how can you navigate the landscape and implement the most effective strategies?
Inventory forecasting involves predicting future demand for products and materials to ensure optimal inventory levels are maintained. Accurate forecasting enables manufacturing leaders to make informed decisions regarding production, procurement, and supply chain management.

By leveraging the right tools and techniques, companies can improve their forecasting accuracy, reduce stockouts and overstock situations, and achieve a competitive edge in the market.
The question arises: What are the most effective tools and techniques for inventory forecasting in the manufacturing industry? How can manufacturing leaders leverage the latest trends and technologies to enhance their forecasting capabilities and drive business success?
According to the statistics from the Manufacturing Outlook Survey conducted by the National Association of Manufacturers (NAM), 72% of manufacturing leaders consider inventory forecasting as a top priority for their organizations. By embracing innovative tools and techniques, manufacturing leaders have the opportunity to streamline their supply chains, optimize inventory levels, and improve overall business performance.
Through actionable insights and practical tips, this article will empower you to make informed decisions and drive success in your inventory forecasting endeavors.
Here is what we shall cover in this post:
- Introduction to Effective Inventory Forecasting
- Inventory Forecasting vs. Replenishment
- Historical Data Analysis for Demand Forecasting
- Collaborative Forecasting With Suppliers and Customers
- Demand Sensing and Real-Time Data for Improved Accuracy
- Implementing ABC and XYZ Inventory Classification Methods
- Future Trends: Advancements in Inventory Forecasting Technology
- How Deskera Can Assist You?
- Conclusion
- Key Takeaways
Introduction to Effective Inventory Forecasting
Effective inventory forecasting is a crucial aspect of inventory management that involves predicting future demand for products and ensuring optimal stock levels. By accurately forecasting inventory needs, businesses can avoid stockouts, minimize excess inventory, and optimize their supply chain operations.
Inventory forecasting relies on historical data, market trends, and various forecasting techniques to estimate future demand and plan inventory accordingly.
- Inventory forecasting helps businesses make informed decisions regarding inventory management. It allows them to plan production schedules, determine reorder points, optimize stock levels, and allocate resources effectively.
- Accurate forecasting enables businesses to meet customer demands, reduce carrying costs, minimize stockouts, and maintain a competitive edge in the market.
- Several factors can influence inventory forecasting, including historical sales data, market trends, seasonality, promotional activities, economic conditions, competitor analysis, and customer behavior.
- Inventory forecasting is an ongoing process that requires regular monitoring and adjustments. Businesses should review and update their forecasts based on actual sales, market changes, and new information.
Benefits of Accurate Inventory Forecasting for Manufacturing
Accurate inventory forecasting is crucial for manufacturing businesses as it brings several benefits that positively impact their operations and overall success. Let's explore some of the key advantages of accurate inventory forecasting in the manufacturing sector:
Cost Reduction: Accurate inventory forecasting helps manufacturers optimize their inventory levels. By accurately predicting demand, businesses can avoid overstocking, which reduces carrying costs associated with storage, handling, and depreciation of inventory.
Conversely, it helps prevent stockouts, eliminating the need for rush orders or expedited shipping, which can be costly. Overall, accurate inventory forecasting leads to cost savings and improved profitability.
Improved Customer Satisfaction: Accurate inventory forecasting ensures that manufacturers have the right products available when customers need them. This leads to improved order fulfillment rates, reduced lead times, and faster delivery, resulting in enhanced customer satisfaction.
Meeting customer expectations regarding product availability and delivery times strengthens relationships and increases customer loyalty.
Efficient Production Planning: Accurate inventory forecasting enables manufacturers to plan their production activities more efficiently. By having a clear understanding of future demand, businesses can schedule production runs, allocate resources, and optimize production capacity.
This minimizes inefficiencies, reduces setup times, and streamlines the production process, ultimately improving productivity and reducing costs.
Effective Supply Chain Management: Accurate inventory forecasting facilitates effective supply chain management. Manufacturers can communicate accurate demand forecasts to their suppliers, enabling them to plan their production and procurement accordingly.
This improves coordination, reduces the risk of stockouts or excess inventory in the supply chain, and ensures the smooth flow of materials and components.
Inventory Turnover Optimization: Accurate inventory forecasting helps optimize inventory turnover, which measures how quickly inventory is sold and replenished.
By aligning inventory levels with actual demand, manufacturers can minimize excess inventory and improve inventory turnover ratios. This leads to better cash flow, reduced carrying costs, and increased efficiency in utilizing working capital.
Minimized Stockouts and Lost Sales: Accurate inventory forecasting helps manufacturers avoid stockouts and the associated lost sales. By having a clear picture of future demand, businesses can ensure they have adequate stock levels to meet customer orders.
This minimizes the risk of stockouts, which can lead to missed sales opportunities, dissatisfied customers, and potential damage to the company's reputation.
Effective Decision-Making: Accurate inventory forecasting provides manufacturers with valuable insights for decision-making. It enables them to make informed decisions regarding production planning, inventory replenishment, pricing strategies, and resource allocation.
Manufacturers can analyze historical data, market trends, and customer demand patterns to make proactive decisions that drive operational efficiency and profitability.
Minimized Obsolescence: Accurate inventory forecasting helps minimize the risk of inventory obsolescence. By having a clear understanding of demand trends, manufacturers can adjust production and inventory levels accordingly.
This reduces the likelihood of holding excessive stock of products that may become outdated, saving costs associated with write-offs and disposal.
Inventory Forecasting vs. Replenishment
Inventory forecasting and replenishment are two closely related concepts in the field of inventory management. While they are interconnected, they serve different purposes and involve distinct processes. Let's explore the differences between inventory forecasting and replenishment:
Inventory Forecasting: Inventory forecasting is the process of estimating future demand for products or materials based on historical data, market trends, and other relevant factors. The goal of inventory forecasting is to predict how much inventory will be needed in the future to meet customer demand and avoid stockouts or overstocking.
Key aspects of inventory forecasting include:
- Data Analysis: Inventory forecasting involves analyzing historical sales data, customer orders, market trends, and other relevant data to identify patterns and trends. Statistical methods, such as time series analysis and regression analysis, are often used to make accurate predictions.
- Demand Planning: Based on the analysis of historical data and market trends, inventory forecasting helps determine the expected demand for products or materials in specific periods, such as weeks, months, or quarters. It helps identify seasonality, trends, and potential demand fluctuations.
- Forecasting Techniques: Various forecasting techniques are employed, such as moving averages, exponential smoothing, and advanced statistical models, to generate accurate demand forecasts. The choice of technique depends on the nature of the data and the complexity of the demand patterns.
- Collaboration: Inventory forecasting often involves collaboration between different departments within a company, such as sales, marketing, and operations. By gathering insights from various stakeholders, the accuracy of the forecasts can be improved.
- Replenishment: Replenishment, on the other hand, is the process of replenishing inventory to maintain optimal stock levels and meet customer demand. It involves determining when and how much inventory should be ordered or produced to fulfill customer orders and maintain a healthy inventory level.
Key aspects of inventory replenishment include:
- Reorder Point: The reorder point is the inventory level at which a replenishment order is triggered. It is based on factors such as lead time, demand variability, and desired service levels. When the inventory level reaches the reorder point, a replenishment order is generated.
- Order Quantity: The order quantity is the amount of inventory that is ordered or produced to replenish stock. It is determined based on factors such as demand forecasts, desired service levels, and economic order quantity (EOQ) calculations.
- Supplier Management: In the case of purchasing finished goods, inventory replenishment involves managing relationships with suppliers and ensuring timely delivery of the ordered products. Effective communication and collaboration with suppliers are essential for smooth replenishment.
- Production Planning: In the case of manufacturing businesses, inventory replenishment involves planning production schedules and allocating resources to meet the forecasted demand. It considers factors such as production capacity, lead times, and material availability.
- Inventory Monitoring: Once the replenishment order is placed or production is initiated, inventory levels are closely monitored to track the progress of replenishment. This ensures that the inventory is replenished on time to meet customer demand.
Types of Inventory Forecasting
Inventory forecasting plays a crucial role in inventory management, helping businesses estimate future demand and plan their inventory levels accordingly. Several types of inventory forecasting methods can be used, depending on the nature of the business, available data, and the desired level of accuracy.
Here are some common types of inventory forecasting:
Time Series Forecasting
Time series forecasting is a popular method used in inventory management to predict future demand patterns based on historical data. It involves analyzing past inventory levels to forecast future inventory requirements. This forecasting technique is particularly useful when there is a consistent and measurable pattern in the inventory data over time.
Here's how time series forecasting can be applied to inventory management:
- Data Collection: The first step in time series forecasting for inventory is to collect historical data on inventory levels. This data should include information on stock quantities over a defined period, such as daily, weekly, or monthly.
- Data Preprocessing: Once the data is collected, it needs to be preprocessed to ensure its quality and suitability for analysis. This may involve removing outliers, handling missing data, and transforming the data if necessary (e.g., logarithmic transformation to stabilize variance).
- Trend Analysis: Time series forecasting begins by analyzing the overall trend in the inventory data. This involves examining whether there is a consistent upward or downward movement in inventory levels over time. Trend analysis can provide insights into the long-term changes in demand and help identify any seasonality or cyclical patterns.
- Seasonal Decomposition: If there is evidence of seasonality in the inventory data, seasonal decomposition techniques can be applied. Seasonal decomposition involves separating the time series data into its seasonal, trend, and residual components. This helps in understanding the periodic variations in inventory levels and enables better forecasting accuracy.
- Forecasting Model Selection: After preprocessing and identifying the trend and seasonality, a suitable forecasting model needs to be selected. Common models used in time series forecasting include moving averages, exponential smoothing, and ARIMA (Auto Regressive Integrated Moving Average) models. The choice of model depends on the characteristics of the inventory data and the desired level of forecasting accuracy.
Techniques for Time Series Inventory Forecasting
Moving Averages: Moving averages involve calculating the average of a fixed number of past observations to smooth out fluctuations and identify trends in the data. Simple Moving Average (SMA) and Weighted Moving Average (WMA) are commonly used methods for inventory forecasting.
Exponential Smoothing: Exponential smoothing assigns exponentially decreasing weights to past observations, giving more weight to recent data. Different variations, such as Single Exponential Smoothing, Double Exponential Smoothing (Holt's Method), and Triple Exponential Smoothing (Holt-Winters Method), provide increased accuracy by considering trends and seasonality.
ARIMA (Auto-Regressive Integrated Moving Average): ARIMA is a powerful technique that combines autoregression (AR), differencing (I), and moving average (MA) components to model and forecast time series data. It can handle data with trends and seasonality, making it suitable for inventory forecasting.
Seasonal Decomposition of Time Series (STL): STL decomposes a time series into its seasonal, trend, and remainder components. This technique helps in understanding the underlying patterns and making more accurate forecasts.
SARIMA (Seasonal ARIMA): SARIMA extends the ARIMA model to incorporate seasonality in the data. It is particularly useful for inventory forecasting in cases where data exhibits both trend and seasonality.
Prophet: Prophet is an open-source forecasting tool developed by Facebook that can capture various time series components, including trends, seasonality, and holidays. It is designed for simplicity and ease of use, making it a popular choice for inventory forecasting.
Deep Learning Approaches: Deep learning models like Recurrent Neural Networks (RNNs) and Long Short-Term Memory (LSTM) networks can capture complex patterns in time series data. These models have shown promising results in inventory forecasting, especially when dealing with large and intricate datasets.
Challenges in Time Series Inventory Forecasting:
Data Quality and Preprocessing: Time series data often exhibit missing values, outliers, and noise. Proper data preprocessing techniques, such as imputation and outlier detection, are essential to ensure accurate forecasting.
Seasonality and Trends: Identifying and handling seasonality and trends can be challenging. Overfitting or underfitting these patterns can lead to inaccurate forecasts.
Dynamic Demand Patterns: Demand patterns can change over time due to various factors, such as promotions, market trends, and economic conditions. Adapting forecasting models to dynamic patterns is a complex task.
Inventory Dynamics: Inventory levels are influenced by reorder points, lead times, and order quantities. Incorporating these dynamics into forecasting models requires careful consideration.
Model Selection and Parameter Tuning: Choosing the right forecasting model and tuning its parameters for optimal performance is a non-trivial task that requires expertise and experimentation.
Applications of Time Series Inventory Forecasting:
Retail and E-commerce: Accurate inventory forecasting ensures that retailers and e-commerce platforms maintain optimal stock levels, reducing the risk of stockouts and overstocking.
Manufacturing: Manufacturers use inventory forecasting to optimize production schedules, minimize excess inventory, and ensure timely availability of raw materials.
Supply Chain Management: Effective supply chain management relies on accurate demand forecasting to streamline logistics, distribution, and procurement processes.
Healthcare: Hospitals and healthcare providers utilize inventory forecasting to manage medical supplies, medications, and equipment, ensuring uninterrupted patient care.
Financial Services: Banks and financial institutions use time series forecasting to manage cash flow, predict market trends, and optimize investment strategies.
Seasonal Forecasting
Seasonal forecasting is a method used in inventory management to predict future demand patterns that exhibit a recurring seasonal pattern. It is particularly useful for industries where demand fluctuates predictably throughout the year, such as retail during holiday seasons or agricultural products during specific growing seasons.
Seasonal forecasting helps businesses anticipate and plan for seasonal variations in demand, enabling more effective inventory management. It allows companies to adjust their production, procurement, and inventory levels accordingly, ensuring sufficient stock during peak seasons and minimizing excess inventory during low-demand periods.
By accurately forecasting seasonal demand patterns, businesses can optimize their inventory levels, reduce holding costs, avoid stockouts, and improve customer satisfaction.
Techniques for Seasonal Inventory Forecasting:
Historical Averages: One of the simplest approaches is to calculate historical average demand during specific seasonal periods. While this method provides a basic understanding of seasonal patterns, it may not capture underlying trends and variations.
Machine Learning and Deep Learning: Advanced machine learning algorithms, such as Random Forests, Gradient Boosting, and Deep Neural Networks, can capture intricate seasonal patterns by considering multiple variables and interactions.
Strategies for Seasonal Inventory Forecasting:
Data Collection and Preprocessing: Accurate forecasting starts with high-quality data. Collecting historical sales data, inventory levels, and external factors (e.g., holidays, promotions) is crucial. Preprocessing steps include data cleaning, outlier removal, and missing value imputation.
Seasonal Pattern Identification: Businesses must identify the type of seasonal pattern (e.g., additive or multiplicative) and its frequency (e.g., daily, weekly, yearly) before selecting an appropriate forecasting technique.
Forecasting Horizon: Determine the time horizon for forecasting based on business goals and the length of the seasonal cycle. Short-term forecasts may focus on immediate inventory management, while long-term forecasts support strategic planning.
Model Selection and Validation: Selecting the right forecasting model involves experimentation and validation. Employ techniques like cross-validation to assess model performance and select the best-fit approach.
Incorporating External Factors: Consider external factors that can influence demand, such as holidays, promotions, and economic conditions. Adjust the forecasting model to accommodate these factors.
Challenges in Seasonal Inventory Forecasting:
Volatile Demand Patterns: Demand patterns can be irregular and volatile, especially during transitional seasons. Adapting forecasting models to handle abrupt changes is a challenge.
Overfitting and Underfitting: Balancing the complexity of forecasting models is essential. Overfitting can lead to poor generalization, while underfitting may result in inaccurate predictions.
Data Scarcity: New businesses or products may lack sufficient historical data for accurate seasonal forecasting. Techniques like proxy data or qualitative insights can help mitigate this challenge.
Multi-Seasonal Patterns: Some products or industries exhibit multiple seasonal patterns simultaneously, such as weekly and yearly cycles. Modeling such complexity requires advanced techniques.
Impact of External Factors: External factors like unexpected events or disruptions can significantly impact seasonal patterns. Forecasting models should be flexible enough to accommodate these changes.
Applications of Seasonal Inventory Forecasting:
Food and Beverage Industry: Restaurants, grocery stores, and beverage manufacturers rely on seasonal forecasting to manage inventory of perishable goods and plan for holiday-related demand spikes.
Fashion and Apparel: The fashion industry leverages seasonal forecasting to predict trends and adjust inventory levels accordingly, minimizing excess inventory and markdowns.
Tourism and Hospitality: Hotels, travel agencies, and tourist destinations use seasonal forecasting to allocate resources, optimize pricing, and enhance customer experience during peak travel seasons.
Agriculture: Farmers and agricultural businesses use seasonal forecasting to optimize planting, harvesting, and distribution schedules based on weather patterns and demand fluctuations.
Historical Data Analysis for Demand Forecasting
Demand forecasting is a crucial aspect of business planning, enabling organizations to make informed decisions about production, inventory management, and supply chain optimization.
Historical data analysis plays a pivotal role in demand forecasting, offering valuable insights into past trends, patterns, and customer behavior. By harnessing the power of historical data, businesses can enhance their forecasting accuracy, minimize risks, and improve operational efficiency.
Gathering and Preparing Historical Data: To perform meaningful historical data analysis, businesses must first gather relevant data from various sources such as sales records, customer orders, market reports, and industry trends.
This data should be cleansed, organized, and standardized to ensure consistency and accuracy. The use of advanced data management tools and techniques can streamline this process and improve the quality of historical data.
Statistical Techniques for Data Analysis: Once the historical data is prepared, businesses can leverage statistical techniques to extract insights and trends. These techniques include time series analysis, regression analysis, moving averages, exponential smoothing, and trend analysis.
Each technique has its strengths and suitability depending on the nature of the data and the specific forecasting requirements. By applying these techniques, businesses can identify seasonality, cyclical patterns, trends, and other factors that influence demand.
Benefits of Historical Data Analysis for Demand Forecasting:
Improved Accuracy: Historical data analysis provides a solid foundation for accurate demand forecasting by leveraging past trends and patterns. This enables businesses to make informed decisions and minimize forecast errors, resulting in better inventory management and resource allocation.
Enhanced Planning and Resource Optimization: By understanding historical demand patterns, businesses can optimize their production schedules, streamline their supply chain operations, and align their resources accordingly. This leads to improved efficiency, reduced costs, and increased customer satisfaction.
Risk Mitigation: Historical data analysis allows businesses to identify and assess risks associated with demand fluctuations, seasonality, market trends, and external factors. This enables proactive risk management strategies, such as buffer stock planning, contingency plans, and alternative sourcing options.
Strategic Decision Making: Historical data analysis provides valuable insights into customer preferences, market dynamics, and competitive trends. This information empowers businesses to make strategic decisions regarding product development, pricing strategies, marketing campaigns, and market expansion.
Utilizing Statistical Models for Inventory Prediction
In the realm of inventory management, accurate prediction of future demand is critical for businesses to optimize their inventory levels, minimize costs, and meet customer expectations.
Statistical models play a vital role in this process, enabling businesses to leverage historical data and mathematical algorithms to forecast future inventory requirements.
Statistical models are mathematical representations that use historical data and statistical techniques to forecast future inventory needs. These models analyze historical sales data, market trends, seasonality, and other relevant factors to generate forecasts.
Commonly used statistical models include time series models, regression models, moving average models, and exponential smoothing models. Each model has its unique approach and is suitable for different scenarios, depending on the nature of the inventory and the forecasting requirements.
Time Series Models for Inventory Prediction: Time series models are widely used in inventory prediction as they capture the patterns and trends in historical data over time. These models consider factors such as seasonality, trend, and cyclical patterns to generate forecasts.
Examples of time series models include ARIMA (Autoregressive Integrated Moving Average), SARIMA (Seasonal ARIMA), and exponential smoothing models. By analyzing past data, time series models can provide accurate predictions of future inventory requirements.
Regression Models for Inventory Prediction: Regression models are employed when there is a relationship between the inventory demand and one or more independent variables. These models analyze historical data to identify the correlation between the independent variables (such as pricing, promotions, or marketing activities) and inventory demand.
Multiple regression, linear regression, and logistic regression are commonly used regression techniques. By incorporating relevant factors, regression models can generate forecasts that account for the impact of various variables on inventory demand.
Here are some additional tips for using statistical models for inventory prediction:
- Use a variety of data sources: The more data you have, the better your forecasts will be. This includes historical demand data, as well as data on prices, marketing campaigns, and competitor activity.
- Clean and prepare your data: Before you use any statistical model, you need to make sure that your data is clean and prepared. This means removing any errors or outliers from the data.
- Choose the right model for your data: Not all statistical models are created equal. Some models are better suited for certain types of data than others.
- Test and evaluate your models: Once you have chosen a model, you need to test it and evaluate its accuracy. This can be done by forecasting historical demand and comparing the forecasts to the actual demand.
Regression Techniques for Inventory Prediction:
- Simple Linear Regression: Simple Linear Regression establishes a linear relationship between a single independent variable and the dependent variable (inventory level). It is suitable when one variable is believed to influence inventory levels significantly.
- Multiple Linear Regression: Multiple Linear Regression extends the concept to multiple independent variables. It captures the combined effect of several factors on inventory levels, allowing for a more comprehensive analysis.
- Polynomial Regression: Polynomial Regression models non-linear relationships between independent and dependent variables. It can capture more complex patterns in inventory data.
- Ridge and Lasso Regression: Regularization techniques like Ridge and Lasso Regression help prevent overfitting by introducing penalties on model coefficients. They are useful when dealing with multicollinearity and high-dimensional data.
- Time Series Regression: Time Series Regression incorporates time-related variables to capture trends, seasonality, and other temporal patterns that affect inventory levels.
- Logistic Regression: Logistic Regression is valuable when predicting binary outcomes, such as whether inventory levels will fall below a certain threshold (stockout prediction).
- Bayesian Regression: Bayesian Regression combines statistical inference with prior knowledge, allowing for uncertainty quantification and more robust predictions.
Challenges and Considerations:
- Multicollinearity: High correlation between independent variables can lead to multicollinearity, affecting the stability and interpretability of regression coefficients.
- Model Selection: Choosing the appropriate regression model requires careful consideration of the data's characteristics, relationships, and underlying assumptions.
- Overfitting and Underfitting: Balancing model complexity to avoid overfitting (high variance) or underfitting (high bias) is crucial for accurate inventory predictions.
- Non-Linear Relationships: While polynomial regression and other techniques address non-linearity, identifying and modeling complex non-linear relationships can be challenging.
- Outliers and Anomalies: Outliers and anomalies in the data can disproportionately influence regression results. Robust techniques or outlier detection methods are necessary.
Demand Planning Techniques for Accurate Forecasting
Demand planning is a critical process for businesses to anticipate customer demand, optimize inventory levels, and ensure efficient supply chain operations. Accurate forecasting is key to successful demand planning, enabling organizations to make informed decisions about production, procurement, and inventory management.
Collaborative Planning, Forecasting, and Replenishment (CPFR):
CPFR is a demand planning technique that emphasizes collaboration between different stakeholders in the supply chain, including manufacturers, distributors, retailers, and suppliers.
By sharing information and working together to develop forecasts, organizations can align their planning efforts and improve the accuracy of demand predictions. CPFR fosters communication, enhances data sharing, and reduces the bullwhip effect, resulting in more accurate forecasts and optimized inventory levels.
Principles and Components of CPFR
Collaborative Planning: Collaborative Planning involves the sharing of information and insights between trading partners to develop a unified plan that aligns with the overall supply chain goals. It focuses on demand forecasting, inventory management, and production planning based on shared insights and data.
Collaborative Forecasting: Collaborative Forecasting aims to create accurate and synchronized demand forecasts by incorporating inputs from all partners. This process mitigates the "bullwhip effect" and enables better decision-making across the supply chain.
Collaborative Replenishment: Collaborative Replenishment ensures that inventory levels are replenished efficiently to meet demand while avoiding overstocking or stockouts. It involves real-time communication and coordination to optimize order quantities and lead times.
Technology Integration: CPFR heavily relies on technology platforms and tools that facilitate information sharing, communication, and data analysis. These tools enable partners to collaborate seamlessly and make informed decisions.
Market Research and Customer Insights:
Gaining a deep understanding of customer preferences, market trends, and emerging consumer behaviors is crucial for accurate demand forecasting. Market research techniques such as surveys, focus groups, and data analysis provide valuable insights into customer expectations, purchasing habits, and market dynamics.
By integrating market research findings into demand planning processes, businesses can refine their forecasts and align their offerings with customer demands, reducing the risk of stockouts or excess inventory.
Statistical Forecasting Models:
Statistical forecasting models utilize mathematical algorithms and historical data to generate demand forecasts. These models include techniques such as time series analysis, regression analysis, and exponential smoothing.
Time series analysis examines historical data to identify patterns, trends, and seasonality, while regression analysis considers the relationship between demand and various factors such as price, promotions, and market conditions. Statistical forecasting models provide a quantitative approach to demand planning, incorporating mathematical calculations and statistical techniques to generate accurate forecasts.
Here are some other factors that can affect the accuracy of demand forecasting:
- The volatility of demand. Products with volatile demand are more difficult to forecast than products with stable demand.
- The availability of data. The more data you have, the better your forecasts will be.
- The complexity of the product or service. Products or services that are complex are more difficult to forecast than products or services that are simple.
- The time horizon of the forecast. Forecasts for the short term are generally more accurate than forecasts for the long term.
Collaborative Forecasting With Suppliers and Customers
By actively involving suppliers and customers in the forecasting process, businesses can leverage their collective knowledge, insights, and data to achieve more accurate demand forecasts.
Shared Information and Data Exchange: Collaborative forecasting starts with establishing effective channels for shared information and data exchange between suppliers, customers, and the business. This involves implementing technologies that facilitate seamless communication and enable the exchange of relevant data such as sales figures, inventory levels, and market insights.
By sharing accurate and up-to-date information, all stakeholders can have a comprehensive view of the demand landscape, leading to more accurate forecasts.
Joint Demand Planning and Forecast Reviews: Collaborative forecasting involves conducting joint demand planning and forecast reviews with suppliers and customers. This collaborative approach allows for the alignment of expectations, identification of potential issues or opportunities, and the development of mutually beneficial strategies.
Regular meetings or workshops can be organized to discuss market trends, promotional activities, product launches, and any other factors that may impact demand. By involving suppliers and customers in the forecasting process, businesses can gain valuable insights and perspectives, leading to more accurate demand forecasts.
Demand Sharing and Consensus Forecasting: Demand sharing and consensus forecasting are key components of collaborative forecasting. In this approach, suppliers and customers actively participate in providing input for the demand forecast. Suppliers share their production capacity, lead times, and potential constraints, while customers provide insights into their anticipated demand patterns and preferences.
Through consensus forecasting, all stakeholders collectively analyze the data and arrive at a shared forecast, ensuring that it reflects the expectations and realities of the entire supply chain. This collaborative effort improves forecast accuracy and helps in avoiding issues such as stockouts or excess inventory.
Supply Chain Visibility and Risk Mitigation: Collaborative forecasting enhances supply chain visibility, allowing all stakeholders to have a clearer understanding of the end-to-end supply chain dynamics. By sharing information on demand fluctuations, supply constraints, and inventory levels, suppliers and customers can proactively identify potential risks and work together to mitigate them.
This collaborative approach helps in optimizing inventory levels, minimizing stockouts, and reducing lead times, resulting in improved customer satisfaction and operational efficiency.
Here are some tips for implementing collaborative forecasting:
- Start small: Don't try to implement collaborative forecasting with all of your suppliers and customers at once. Start with a small group of partners that you trust and have a good relationship with.
- Choose the right tools: There are several software tools available to help you with collaborative forecasting. Choose a tool that is easy to use and that meets the needs of your supply chain.
- Set clear expectations: Before you start collaborative forecasting, make sure that all of the partners involved understand the goals of the program and their responsibilities.
- Communicate regularly: Collaborative forecasting requires regular communication between supply chain partners. Make sure that you have a process in place to share data and insights regularly.
- Measure the results: Once you have implemented collaborative forecasting, it is important to measure the results. This will help you to determine whether the program is meeting your goals.
Incorporating Market Trends and External Factors
In the ever-evolving business landscape, demand forecasting has become a critical process for organizations to effectively plan their operations, optimize inventory, and meet customer expectations. To enhance the accuracy of demand forecasts, it is crucial to incorporate market trends and external factors that influence consumer behavior and market dynamics.
Monitoring Market Trends: Demand forecasting should go beyond historical data analysis and incorporate the analysis of market trends. Monitoring market trends involves keeping a close eye on factors such as consumer preferences, changing demographics, technological advancements, economic conditions, and industry-specific developments.
By understanding how these trends impact customer behavior and demand patterns, businesses can adjust their forecasts accordingly and proactively respond to market shifts.
Competitive Analysis: Incorporating competitive analysis is essential in demand forecasting. Analyzing competitors' activities, product launches, pricing strategies, and promotional campaigns help businesses gain insights into market dynamics and potential changes in demand.
By understanding the competitive landscape, organizations can anticipate shifts in customer preferences and adjust their forecasts to capture market share effectively.
External Factors: External factors play a significant role in shaping demand patterns. These factors can include weather conditions, seasonal variations, regulatory changes, geopolitical events, and social trends. By considering these external factors in demand forecasting, businesses can make more accurate predictions about how they will impact consumer behavior and demand.
For example, clothing retailer can adjust their inventory levels based on seasonal demand fluctuations or incorporate regulatory changes in their forecasting models to anticipate changes in consumer preferences.
Data-driven Forecasting Models: Incorporating market trends and external factors requires leveraging advanced data-driven forecasting models. These models use algorithms and statistical techniques to analyze historical data, market trends, and external factors to generate accurate demand forecasts.
Machine learning and artificial intelligence technologies can be utilized to identify patterns, correlations, and anomalies in the data, enabling businesses to make more informed decisions and predictions about future demand.
Here are some of the most important market trends and external factors to consider when incorporating them into demand forecasting models:
- Economic conditions: Changes in economic conditions, such as GDP growth, unemployment rates, and inflation rates, can have a significant impact on demand for products or services. For example, a recession can lead to a decrease in demand, while an economic boom can lead to an increase in demand.
- Competitor activity: The activities of competitors, such as new product launches, pricing changes, and marketing campaigns, can also have a significant impact on demand for products or services. For example, if a competitor launches a new product that is similar to yours, you may see a decrease in demand for your product.
- Technological innovations: Technological innovations can also have a significant impact on demand for products or services. For example, the introduction of new technology can make existing products obsolete, or it can create new demand for new products.
- Social and demographic trends: Social and demographic trends, such as changes in population growth, age distribution, and income levels, can also have a significant impact on demand for products or services. For example, an aging population may lead to an increase in demand for products and services for seniors.
Seasonal Forecasting for Inventory Optimization
Seasonality is a significant factor that influences consumer demand across various industries. Businesses that experience seasonal fluctuations in demand must effectively manage their inventory to avoid stockouts or excess inventory during different periods of the year.
Seasonal forecasting plays a crucial role in optimizing inventory levels, reducing costs, and maximizing profitability.
Analyzing Historical Sales Data: To effectively forecast seasonal demand, businesses must analyze historical sales data for previous seasons. By identifying patterns and trends, organizations can gain insights into the specific periods of high and low demand. This analysis helps in understanding the magnitude and duration of each season and serves as the foundation for developing accurate seasonal forecasts.
Historical sales data can be segmented by product, region, customer segment, or any other relevant factors to capture specific seasonal trends accurately.
Identifying Seasonal Factors and Drivers: Understanding the factors and drivers that influence seasonal demand is essential for accurate forecasting. Factors such as weather conditions, holidays, cultural events, school calendars, and promotional activities can significantly impact consumer behavior during different seasons.
By identifying these factors and incorporating them into the forecasting models, businesses can account for their effects on demand and adjust inventory levels accordingly. This enables them to meet customer demands without excess inventory or stockouts.
Collaborating with Suppliers and Retailers: Effective seasonal forecasting requires collaboration with suppliers and retailers throughout the supply chain. Suppliers must be informed about the expected increase or decrease in demand during specific seasons to ensure an uninterrupted supply of raw materials or finished goods.
Retailers, on the other hand, can provide valuable insights into customer preferences, purchasing patterns, and the anticipated demand for specific products during different seasons. Collaborative forecasting allows for better synchronization of supply and demand, reducing the risk of overstocking or understocking.
Flexible Inventory Management Strategies: Seasonal forecasting enables businesses to adopt flexible inventory management strategies to optimize inventory levels. For seasonal peaks, businesses can increase inventory to meet anticipated demand while minimizing the risk of stockouts. Conversely, during off-peak seasons, inventory levels can be reduced to avoid excess carrying costs.
By aligning inventory levels with expected seasonal demand, organizations can maximize efficiency, reduce storage costs, minimize the risk of obsolescence, and improve overall profitability.
Demand Sensing and Real-Time Data for Improved Accuracy
Demand sensing refers to the ability to capture and analyze real-time data to gain immediate insights into customer demand patterns. Unlike traditional forecasting methods that rely on historical data and predefined models, demand sensing leverages real-time data from various sources, such as point-of-sale systems, social media, web analytics, and IoT sensors.
By monitoring these data streams, businesses can detect shifts in demand patterns, identify emerging trends, and respond quickly to changing market conditions.
Real-Time Data Analytics: Real-time data analytics is the foundation of demand sensing. Advanced analytics techniques, including machine learning and artificial intelligence, enable organizations to process vast amounts of data in real time and extract meaningful insights.
By analyzing data from diverse sources, businesses can identify demand patterns, customer preferences, and market trends as they happen. Real-time data analytics also helps in identifying outliers, anomalies, and sudden shifts in demand, allowing for agile decision-making and proactive inventory management.
Enhanced Forecasting Accuracy: By incorporating demand sensing and real-time data analytics into demand forecasting processes, organizations can achieve significantly improved accuracy. Real-time data provides a more granular view of customer behavior, enabling businesses to understand demand drivers at a micro-level.
This level of detail helps in identifying short-term fluctuations, seasonal variations, and even unforeseen events that impact demand. With accurate and timely insights, businesses can adjust inventory levels, production schedules, and supply chain operations accordingly, minimizing stockouts and excess inventory.
Collaborative Demand Sensing: Demand sensing is not limited to internal data sources but also involves collaboration with external partners. Collaborative demand sensing involves sharing real-time data with suppliers, retailers, and other stakeholders to gain a holistic view of the demand ecosystem.
By collaborating and sharing data, organizations can synchronize their operations, align inventory levels, and respond effectively to changing demand patterns. This collaborative approach enhances supply chain efficiency, reduces lead times, and improves overall customer satisfaction.
Applying Machine Learning Algorithms in Inventory Forecasting
Machine learning is a branch of artificial intelligence that enables computers to learn from data and make predictions or decisions without being explicitly programmed. In the context of inventory forecasting, machine learning algorithms analyze historical data, identify patterns, and create models that can predict future demand with greater accuracy.
By continuously learning from new data, these algorithms adapt and improve their predictions over time, enabling businesses to make informed inventory decisions.
Data Preprocessing and Feature Engineering: A crucial step in applying machine learning algorithms to inventory forecasting is data preprocessing and feature engineering.
This involves cleaning and transforming raw data, removing outliers, handling missing values, and selecting relevant features that influence demand. By ensuring data quality and extracting meaningful features, businesses can build robust models that capture the underlying demand patterns accurately.
Selection of Machine Learning Algorithms: Various machine learning algorithms can be applied to inventory forecasting, including linear regression, decision trees, random forests, gradient boosting, and neural networks. The selection of the most appropriate algorithm depends on the complexity of the data and the forecasting requirements.
Ensemble techniques, such as combining multiple algorithms, can also be employed to improve forecasting accuracy. The choice of algorithm is a critical factor in achieving reliable and accurate predictions.
Continuous Learning and Model Refinement: One of the key advantages of machine learning is its ability to continuously learn from new data and refine forecasting models. As new demand data becomes available, businesses can update their models, retrain the algorithms, and incorporate the latest information to improve forecasting accuracy.
This iterative process ensures that the models adapt to changing market dynamics, emerging trends, and seasonal variations, leading to more accurate and reliable inventory forecasts.
Implementing ABC and XYZ Inventory Classification Methods
Efficient inventory management is crucial for businesses to optimize their supply chain, reduce costs, and meet customer demands effectively. Two widely used inventory classification methods, ABC analysis, and XYZ analysis, provide valuable insights for prioritizing inventory control efforts.
ABC Analysis: ABC analysis categorizes inventory items into three groups based on their value and importance. The classification is determined by calculating the annual consumption value of each item. The groups are as follows:
- Group A: High-value items with a significant impact on revenue. These items typically represent a small percentage of the total inventory but contribute to a significant portion of the revenue.
- Group B: Moderate-value items that have a moderate impact on revenue. These items make up a moderate percentage of the inventory and contribute to a moderate portion of the revenue.
- Group C: Low-value items with a minimal impact on revenue. These items represent a large percentage of the inventory but contribute to a relatively small portion of the revenue.
Methods of ABC Analysis
Value-Based Classification: In this method, items are classified based on their monetary value, usually annual consumption value or revenue contribution. Class A items have the highest value, Class B items have moderate value, and Class C items have the lowest value.
Usage-Based Classification: Items are classified based on their usage frequency or quantity. High-usage items fall into Class A, moderate-usage items into Class B, and low-usage items into Class C.
Unit Cost or Margin-Based Classification: This method considers the cost or profit margin per unit of each item. Items with high unit cost or margin belong to Class A, those with moderate unit cost or margin belong to Class B, and those with low unit cost or margin belong to Class C.
Criticality-Based Classification: Items are classified based on their criticality to production or service delivery. Critical items that could disrupt operations are in Class A, moderately critical items in Class B, and less critical items in Class C.
Implementing ABC analysis helps businesses focus their inventory management efforts by prioritizing attention on high-value items (Group A) that have the most significant impact on the bottom line.
XYZ Analysis: XYZ analysis classifies inventory items based on their demand variability and predictability. The classification is determined by analyzing historical demand data. The groups are as follows:
- Group X: Items with stable and predictable demand patterns. These items have a consistent demand, making it easier to forecast and manage inventory levels.
- Group Y: Items with moderate demand variability. These items have a moderate level of unpredictability in demand, requiring closer monitoring and responsive inventory management.
- Group Z: Items with high demand variability and unpredictability. These items exhibit volatile demand patterns, necessitating agile and flexible inventory management strategies.
Methodology of XYZ Analysis
Consumption Rate: The primary criterion for XYZ Analysis is the consumption rate of items. This can be measured using metrics such as usage quantity, frequency, or sales volume over a specific period.
Percentage Contribution: Items are ranked based on their percentage contribution to total consumption. This ranking is then used to categorize items into the X, Y, and Z classes.
Frequency of Reassessment: XYZ Analysis is not a one-time process; it involves regular reassessment of item consumption patterns to ensure accurate classification and informed decision-making.
By implementing XYZ analysis, businesses can tailor their inventory management approaches based on the demand characteristics of each item, ensuring optimal stock levels and minimizing the risk of stockouts or excess inventory.
Benefits of ABC and XYZ Analysis:
- Optimal Resource Allocation: ABC analysis enables businesses to allocate resources, such as time and effort, more efficiently by focusing on high-value items that contribute the most to revenue.
- Inventory Control: Both ABC and XYZ analysis help in setting appropriate inventory control policies. High-value items (Group A) and items with high demand variability (Group Z) require more attention and proactive management.
- Demand Planning: XYZ analysis aids in demand planning by considering the predictability of demand patterns. It enables businesses to align their procurement, production, and distribution processes accordingly.
- Cost Reduction: By categorizing items and identifying high-value items, businesses can reduce holding costs by implementing different inventory management strategies for each group.
Implementation Considerations: To implement ABC and XYZ analysis effectively, businesses should consider the following:
- Accurate Data: Ensure reliable and up-to-date data on item values, sales, and demand patterns.
- Segmentation Criteria: Define appropriate segmentation criteria based on revenue impact (ABC analysis) and demand variability (XYZ analysis) that align with business objectives.
- Regular Review: Regularly review and update the classifications as business dynamics and market conditions change.
- Integration with Inventory Management Systems: Integrate ABC and XYZ classifications into inventory management systems to automate monitoring and decision-making processes.
Safety Stock Calculation for Risk Mitigation
Safety stock plays a crucial role in inventory management by providing a buffer against demand variability, supply chain disruptions, and other uncertainties. It acts as a contingency measure to mitigate risks and ensure uninterrupted operations.
Understanding Safety Stock: Safety stock refers to the extra inventory held beyond the expected demand during a specific period. It serves as a cushion to accommodate unforeseen events, such as unexpected spikes in customer demand, supply chain delays, or production interruptions.
Safety stock acts as a risk mitigation strategy, allowing businesses to fulfill customer orders promptly and maintain service levels even under unpredictable circumstances.
Factors Influencing Safety Stock Calculation: Several factors impact the calculation of safety stock, including:
- Demand Variability: Variations in customer demand, such as seasonal fluctuations, market trends, and promotional activities, need to be considered.
- Lead Time Variability: The variability in the time taken for suppliers to deliver raw materials or finished goods affects safety stock requirements.
- Service Level Objectives: The desired level of customer service, typically expressed as a percentage of orders that must be fulfilled promptly influences safety stock decisions.
- Supply Chain Performance: The reliability and performance of suppliers, transportation, and production processes impact safety stock needs.
- Risk Tolerance: The level of risk a business is willing to accept and its impact on inventory carrying costs and customer satisfaction.
Safety Stock Calculation Methods: Several approaches can be used to calculate safety stock, depending on the available data and business requirements:
- Historical Demand Analysis: Analyzing historical demand patterns and variability can provide insights into determining the safety stock level. Statistical techniques such as standard deviation, mean absolute deviation or coefficient of variation are commonly used.
- Service Level Approach: Setting the desired service level, typically expressed as a percentage, and using statistical methods such as the normal distribution to calculate safety stock that ensures the desired service level is met.
- Reorder Point Method: Determining the reorder point by considering lead time, average demand, and safety stock requirements. Safety stock is calculated based on the variability of demand and lead time, ensuring that stock is available when needed.
- Advanced Forecasting and Simulation: Utilizing advanced forecasting models, simulation techniques, and predictive analytics to account for complex demand patterns, lead time variability, and supply chain risks. This approach offers a more comprehensive and accurate estimation of safety stock needs.
Monitoring and Adjusting Forecasts Based on Performance
Monitoring forecast performance is crucial for several reasons:
- Identifying Forecast Errors: By comparing actual demand with forecasted values, businesses can detect and quantify forecast errors, understanding where and why deviations occur.
- Evaluating Forecast Accuracy: Measuring the accuracy of forecasts allows businesses to assess the reliability of their forecasting methods and make informed decisions about inventory planning.
- Identifying Demand Patterns: Analyzing forecast errors can reveal underlying demand patterns, such as seasonality, trends, or unusual events, which can be valuable for future forecasting improvements.
- Managing Inventory Costs: Forecast errors directly impact inventory carrying costs. Monitoring performance helps businesses optimize stock levels, reducing excess inventory or stockouts.
Key Performance Metrics: Several metrics help evaluate forecast performance:
- Mean Absolute Percentage Error (MAPE): Measures the average percentage difference between forecasted and actual demand, providing an overall accuracy assessment.
- Bias: Evaluates the systematic over- or underestimation of forecasts. Positive bias indicates overestimation, while negative bias reflects underestimation.
- Forecast Error Variability: Examines the consistency of forecast errors. High variability suggests difficulty in predicting demand accurately.
- Tracking Signal: Monitors the cumulative forecast error over time, indicating if the forecasts are consistently above or below the actual demand.
Adjusting Forecasts: Based on forecast performance analysis, adjustments can be made to improve accuracy:
- Collaborative Demand Sensing: Engaging with key stakeholders, such as customers, suppliers, and sales teams, to gather real-time market insights, capture demand signals, and refine forecasts accordingly.
- Continuous Forecast Review: Regularly reviewing and updating forecasts based on the latest market trends, customer feedback, and changes in business conditions.
- Incorporating Leading Indicators: Identifying and incorporating leading indicators, such as market research, economic indicators, or social media sentiment analysis, to enhance the accuracy of demand forecasts.
- Advanced Analytics and Machine Learning: Leveraging advanced analytics techniques and machine learning algorithms to identify complex demand patterns, detect anomalies, and improve forecast accuracy.
Future Trends: Advancements in Inventory Forecasting Technology
Artificial Intelligence and Machine Learning
Artificial intelligence (AI) and machine learning (ML) are transforming inventory forecasting by enabling more accurate and automated demand predictions. AI algorithms can analyze vast amounts of historical data, identify patterns, and generate forecasts with minimal human intervention.
ML models continually learn and adapt based on real-time data, improving forecast accuracy over time. These technologies can handle complex demand patterns, consider multiple variables, and provide real-time insights for proactive decision-making.
Big Data Analytics
The availability of vast amounts of data from various sources, including point-of-sale systems, social media, IoT sensors, and supply chain networks, presents opportunities for advanced data analytics in inventory forecasting. Big data analytics allows businesses to leverage structured and unstructured data to uncover hidden patterns, trends, and correlations.
By integrating diverse data sources and applying advanced analytics techniques, businesses can generate more accurate demand forecasts and respond swiftly to changing market dynamics.
Predictive Analytics
Predictive analytics leverages historical data, statistical algorithms, and ML techniques to anticipate future demand patterns accurately. By analyzing past sales data, market trends, customer behavior, and external factors, predictive analytics models can forecast demand with higher precision.
These models consider seasonality, promotions, economic indicators, and other relevant factors to provide actionable insights for inventory planning, reducing stockouts, and excess inventory.
Demand Sensing and Real-Time Data
Real-time data integration and demand sensing technologies enable businesses to capture up-to-the-minute demand signals. By collecting data from various sources, such as IoT devices, point-of-sale systems, and social media, businesses can respond promptly to shifts in customer demand.
Demand sensing allows for agile decision-making, ensuring inventory levels are adjusted to align with current demand patterns. Real-time data insights enable businesses to optimize inventory positions, reduce lead times, and enhance customer service levels.
Cloud-Based Forecasting Solutions
Cloud-based inventory forecasting solutions offer several benefits, including scalability, accessibility, and collaborative features. These solutions enable businesses to store and process large volumes of data securely, access forecasting tools from anywhere, and facilitate real-time collaboration among cross-functional teams.
Cloud-based solutions also offer advanced analytics capabilities, allowing businesses to leverage AI and ML algorithms without extensive IT infrastructure investments.
Integration with Supply Chain Management Systems
Seamless integration between inventory forecasting systems and supply chain management (SCM) systems is becoming increasingly important. The ability to share real-time data between forecasting, procurement, production, and distribution systems enhances visibility and facilitates efficient inventory management.
The integration enables businesses to align inventory levels with production schedules, optimize order quantities, and improve overall supply chain efficiency.
How Deskera Can Assist You?
Deskera ERP and MRP system can help you:
- Manage production plans
- Maintain Bill of Materials
- Generate detailed reports
- Create a custom dashboard
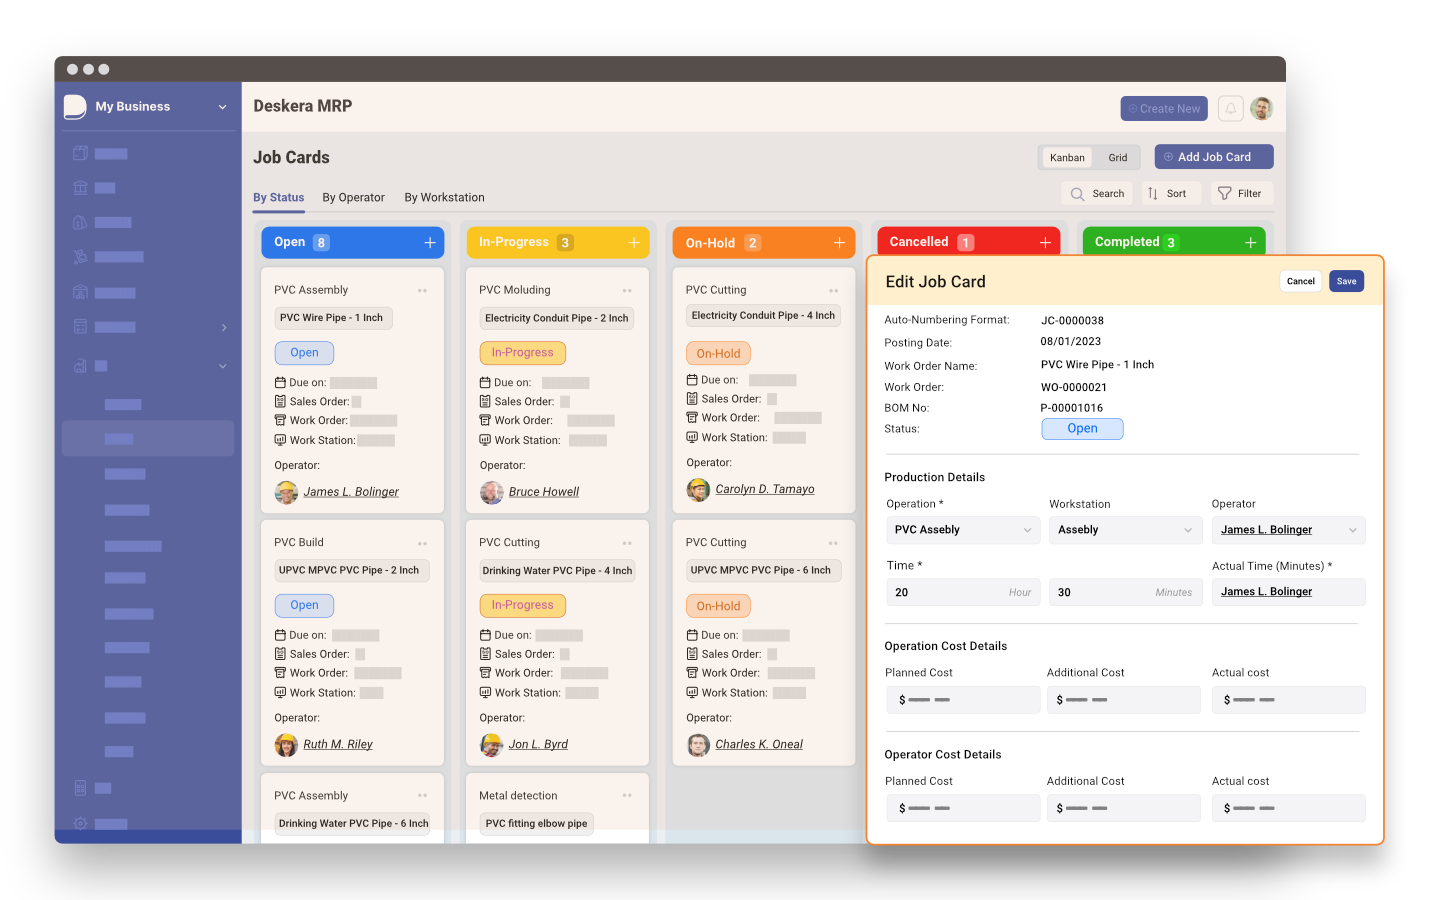
Deskera ERP is a comprehensive system that allows you to maintain inventory, manage suppliers, and track supply chain activity in real-time, as well as streamline a variety of other corporate operations.
Deskera MRP allows you to closely monitor the manufacturing process. From the bill of materials to the production planning features, the solution helps you stay on top of your game and keep your company's competitive edge.
Deskera Books enables you to manage your accounts and finances more effectively. Maintain sound accounting practices by automating accounting operations such as billing, invoicing, and payment processing.
Deskera CRM is a strong solution that manages your sales and assists you in closing agreements quickly. It not only allows you to do critical duties such as lead generation via email, but it also provides you with a comprehensive view of your sales funnel.
Deskera People is a simple tool for taking control of your human resource management functions. The technology not only speeds up payroll processing but also allows you to manage all other activities such as overtime, benefits, bonuses, training programs, and much more. This is your chance to grow your business, increase earnings, and improve the efficiency of the entire production process.
Conclusion
Effective inventory forecasting is a critical aspect of successful inventory management for manufacturing leaders. It plays a vital role in optimizing inventory levels, reducing costs, improving customer satisfaction, and driving overall operational efficiency.
By implementing the right tools and techniques, manufacturing leaders can enhance their forecasting capabilities and make more informed decisions about inventory planning and control.
Furthermore, the article highlighted the significance of leveraging technology for inventory forecasting. Advanced inventory management systems, integrated with enterprise resource planning (ERP) software, can automate data collection, streamline processes, and provide real-time visibility into inventory levels and demand patterns.
These systems can also generate accurate forecasts and alerts, enabling proactive decision-making and timely replenishment.
The importance of collaboration and data sharing was also emphasized in the article. Effective communication and collaboration among various stakeholders, including suppliers, customers, and internal departments, can provide valuable insights into demand fluctuations, lead times, and market conditions. Sharing accurate and timely information allows for a more holistic view of the supply chain and enables better forecasting accuracy.
Key Takeaways
- Statistical forecasting methods like moving averages, exponential smoothing, and regression analysis can help manufacturing leaders predict future demand accurately.
- Advanced techniques such as time series analysis, demand sensing, and predictive analytics improve forecasting accuracy by considering external factors and market trends.
- Technology plays a vital role in inventory forecasting, with advanced inventory management systems and ERP software automating data collection and providing real-time visibility into inventory levels.
- Collaboration and data sharing among stakeholders, including suppliers and customers, provide valuable insights for more accurate forecasting.
- Regular evaluation and fine-tuning of forecasting models are essential to ensure they remain relevant and effective.
- Continuous improvement in data quality and integrity is necessary for meaningful and reliable forecasting outcomes.
- Data analytics tools and visualization techniques help identify trends, patterns, and anomalies in the data for better forecasting insights.
- Effective inventory forecasting should be integrated with other supply chain practices, considering factors like lead times, production capacity, and customer demand variability.
- Accurate demand forecasting allows manufacturing leaders to align production and procurement plans, minimizing stockouts and excess inventory.
- Demand-driven forecasting focuses on understanding customer needs and aligning production accordingly, improving customer satisfaction.
Related Articles
 Nidhi Mahana
 RVJ
RVJ Damini
 Damini