
As a manufacturer, you want to have total control over every step of the production process, isn’t it?
Of course, you would!
However, stressing about how to address today's pressing issues, such as the increase in demand, the depletion of resources, the instability of the economy, and so on, could keep you from accomplishing your goal.
Then, Statistical Process Control (SPC) is the solution. SPC assist companies as crucial tool for monitoring and improving process control. Businesses all around the world are already using Statistical Process Control (SPC) charts as essential instruments for tracking and enhancing process control.

In this article, we'll look into SPC manufacturing, a technique for quality enhancement that may be used to gather information about your production processes so that you can monitor them and make the required adjustments.
Let’s take a look at what we’ll cover ahead:
- What is Manufacturing Quality Control?
- What is Statistical Process Control (SPC)?
- History of SPC
- Fundamentals of Statistical Process Control (SPC)
- Significance of Statistical Process Control (SPC)
- Statistical Process Control Benefits
- Objectives of Statistical Process Control (SPC)
- Need for Statistical Process Control (SPC)
- Statistical Process Control (SPC) Applications
- Several Tools Used in Statistical Process Control (SPC)
- SPC Manufacturing Implementation Steps that You Need to Follow
- How Deskera Can Assist You?
Let's begin!
What is Manufacturing Quality Control?
The efficient administration of the entire manufacturing process, from the lab to the label, requires well-designed quality control systems that can detect issues in real-time and foresee issues before they arise.
These comprehensive offerings assist businesses in achieving consistency in quality and product integrity over the course of the manufacturing lifecycle.
Additionally, an integrated set of software modules for Statistical Process Control (SPC), electronic workflow management, corrective actions, at-line/in-line testing, Electronic Work Instructions (EWI), alarms, and Laboratory Information Management Systems are combined to achieve this (LIMS).
Key capabilities allow you to:
- Make sure all relevant tests and procedures are fully accountable by enforcing the appropriate calculations and checks.
- Establish procedures to identify infractions and take immediate corrective action.
- Users get access to complete ancestry records and process logs because all quality and defect information is kept and traced.
- Ensure that all paperwork is accurate and includes the required electronic signatures.
- Deviations from the limit and legal violations should be reported to supervisors, other employees, and auditors.
- Utilize various data displays and analysis tools (e.g., Xbar, Capability Analysis, Pareto, Trend Charts)
- Enforce the approval process to ensure that all inspections have been done properly before the product is delivered (such as HACCP, label compliance, and weights).
- Utilize resources for accurate and flexible data collection (such as external data sources, automated data sources, manual entry, gauge integration)
What is Statistical Process Control (SPC)?
SPC, or statistical process control, is the industry standard for managing and monitoring quality throughout manufacturing processes.
Using SPC tools and techniques, you can keep an eye on process behavior, spot internal system issues, and fix production-related issues.
Furthermore, real-time data gathering on your products or processes is used in SPC production, and a graph with pre-set control limits is used to evaluate its efficacy.
You can determine your control limits by looking at the capacity of your production lines. If the data you collect fits inside your control parameters, this means that everything is working as it should.
On the other hand, if the data deviates from your intended range of control, this suggests that there might be issues, and something needs to be adjusted in your production process before they worsen.
Using the data, you have acquired, you can determine the value of an SPC solution and identify the areas of waste and inefficiency in your firm by asking yourself the following questions:
- How much do you price for excellence?
- Can you use the data you're gathering to improve?
- Are the correct data being gathered in the right locations?
- Using the latest data, are business decisions being made?
- Can you immediately identify the source of a quality issue?
- Are you aware of the proper times to do preventative maintenance?
- And do your demand forecasts reflect actual demand?
History of SPC
Interestingly, SPC has been around for more than a century. Walter A. Shewhart developed the control chart and the notion that a process might be under statistical control in 1924 at Bell Telephone Laboratories in the United States.
Process Control. To evaluate if a process was under control or not, he built a control chart. In 1939, he published "Statistical Method from the Perspective of Quality Control."
During World War II, the use of control charts rapidly grew in the United States in order to ensure the quality of weapons and other vitally important products.
However, SPC techniques were less often employed after the war.
SPC work was updated and developed after the war, and Dr. W. Edwards Deming carried it to Japan, where Japanese businesses eagerly adopted the concepts.
Many SPC strategies have become more well-liked among firms globally in recent years, particularly as a result of quality improvement programs like Six Sigma.
Statistical software programs and advanced data collection methods have greatly aided the widespread adoption of control charting approaches.
These are some other process-monitoring tools:
- Cumulative Sum (CUSUM) charts:
Each point's ordinate is calculated by adding its predecessor's ordinate to any most recent departures from the objective.
- Exponentially Weighted Moving Average (EWMA) charts:
The weighted average of the most recent subgroup value and all previous subgroup values is shown at each chart point, with weights for older data falling and weights for more current process history increasing.
Fundamentals of Statistical Process Control (SPC)
A few fundamental concepts must be covered before delving into the statistical process control tools and procedures. The values of critical parameters pertaining to a component or product are established during engineering's creation process.
These characteristics are frequently defined using the nominal value anticipated from the production process and the related tolerance ranges.
Different values can be established for a given parameter depending on the application and the needs of the client. Building the required product will be more difficult and costlier the more precise the tolerances.
Dr. Walter A. Shewhart deserves praise for using statistical analysis techniques in part manufacturing. In order to demonstrate how the process is doing over time, he proposed the idea of continually monitoring it as parts are produced. Data would then be projected on a series of graphs known as control charts.
He recognized that while some variation is to be expected, there is a distinction between expected variation and unexpected variation. As a result, there are two types of process variations:
- Common cause variations (expected variations)
- Assignable cause variations (unexpected variations)
The majority of common cause fluctuations are system-internal and outside the control of the machine operator. Only changing the work methods or the process-related equipment (such as upgrading from an older, less expensive machine model to a newer, more expensive version that is naturally capable of superior precision) will lessen frequent cause variations.
Those variations with a known cause are those from external sources. Consider issues with the raw materials utilized in the production process, issues with the equipment, or operator error as examples.
The main goal of SPC is to separate variations from those with an assignable cause from those with a common source so that you can respond to the latter rather than the former.
Processes that are operating and exhibiting only common cause variations are, by definition, under control; as a result, they are manufacturing the process's components as efficiently as possible and don't require modification.
It is possible to predict, up to a point, how a process will behave in the future when it is under control by looking at previous data.
By gathering and analyzing data, statistical process control is used to keep an eye on processes, evaluate if they are staying stable and under control, and make sure the process will continue to generate parts that are acceptable in the future.
It should be made clear that exercising control does not automatically translate into being able to achieve the intended outcome. Even though a process is under control, a desirable result is not always the result.
Significance of Statistical Process Control (SPC)
The cost associated with process and product failures is known as the cost of poor quality (COPQ), and it is quantified in the manufacturing sector.
Average manufacturers are 5X more likely to spend money on scrap, rework, faults, retesting, and recalls than the leaders in the sector. The best producers have COPQ scores of less than 1%, whereas average producers have scores of 5% or more.
A successful, economical, and flexible technique is statistically evaluated by SPC.
It is a preventative approach, which is more time and money efficient than finding the problem after it has already happened.
Statistical Process Control Benefits
Following we have discussed statistical process control benefits. Let's learn:
- GIGO (garbage in, garbage out) is avoided
- Reduces and locates process errors
- Enhances process uniformity and quality
- Increased client satisfaction
- Improvement potential at the corporate level
- Halts the production of nonconforming goods
- Reduce waste and rework while improving output
- Continual observation of the process to maintain control
- Provide decision-supporting information and streamline the process
Objectives of Statistical Process Control (SPC)
Using SPC manufacturing, you can improve the quality of your products by looking into:
- The goods and services you provide to customers
- The management's vision and dedication
- Continual improvement
- Responsiveness
- Use of data to inform choices
- Team member involvement; and
- Dedication to producing high-quality work
By integrating SPC technologies into your business, you'll have better control over:
- Handling internal rejections,
- Claims,
- Clients,
- Obtaining supplies,
- Suppliers,
- Evaluating any corrective actions that have been taken
When handled correctly, each of these statistical process control examples helps to improve the caliber of your production.
The development and use of these performance indicators are (directly or indirectly) influenced by management, consumer demands, and customer satisfaction.
Let's now examine the many sorts of SPC manufacturing that you need to be aware of.
Need for Statistical Process Control (SPC)
Today's manufacturing businesses face more fierce competition. Meanwhile, the cost of raw materials keeps going up and therefore it is important to take care of raw material inventory management as well.
Companies must therefore focus on their processes, which they can manage. Businesses need to prioritize improving quality, efficiency, and decreasing costs.
Many businesses still check the quality of their items after they have been made. By using the SPC technique, a company can transition from detection-based to prevention-based quality management.
The operator can see trends or changes by continuously monitoring the process's performance before they lead to non-conforming products and scrap.
Statistical Process Control (SPC) Applications
With the right tools, SPC procedures are straightforward to implement. Regardless of size, industry, or kind, there are many products that may be customized to match the needs of any type of organization.
SPC is used to improve each component of each stage of manufacturing. Although production speed is undoubtedly important to manufacturers, SPC can also improve other factors. Implementing SPC in the Manufacturing Sector
- Reducing manufacturing defects
- Boosts productivity
- Improves quality
- Cutting down on energy and material waste
There are countless options. Every step of the process is essential, and manufacturers may use SPC management to improve their operations by identifying what needs to be done in the data.
If you don't continually look for ways to improve your manufacturing processes, you will swiftly be displaced by a competing company in this highly competitive market.
Furthermore, the manufacturing process should be assessed to identify the main waste regions prior to implementing SPC or any other quality system.
Things like scrap, rework, and additional inspection time are examples of waste in the production process. For the greatest advantage, the SPC tools should be applied first in these areas.
Not all dimensions are examined during SPC because of the associated costs, time commitments, and production delays. Before implementing SPC, a Cross Functional Team (CFT) should conduct a print review or Design Failure Mode and Effects Analysis (DFMEA) exercise to identify the core or essential elements of the design or process.
It would therefore be necessary to collect and keep track of data on these important or noteworthy features.
Several Tools Used in Statistical Process Control (SPC)
The manufacturing process should be examined to find any significant waste areas before beginning any production.
SPC or the adoption of any new quality system. Rework, scrap, and additional inspection time are examples of waste that can occur during the production process.
The best course of action in these areas would be to start by utilizing SPC tools. SPC doesn't evaluate every dimension because it would be costly, labor-intensive, and would cause production delays. looking over the prints or conducting a Design Failure Mode and Effects Analysis.
The cross-functional team should identify the crucial elements of the design or process before implementing SPC. Then data on these crucial or relevant characteristics would be gathered and tracked. An SPC control chart can be used to analyze this data.
Analyzing the data
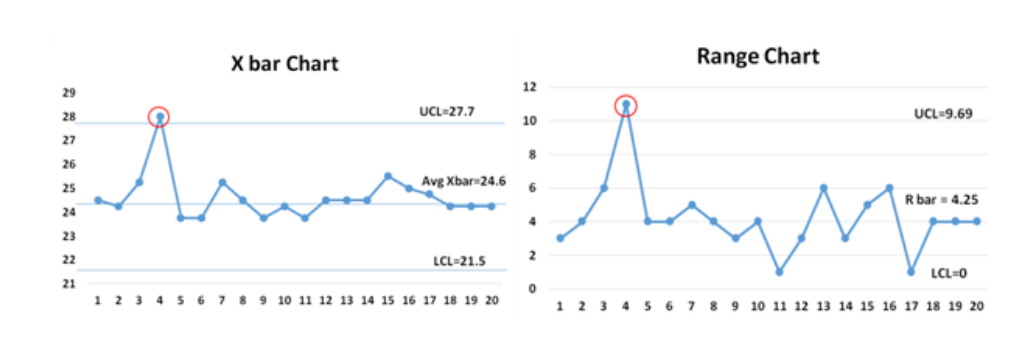
The data currently available on a control chart must lie between the control boundaries if only conventional factors and no unusual causes have been found.
Regular causes will fall within the control boundaries, however exceptional causes frequently produce outliers that surpass them inside the prescribed limits. There must be any surprising patterns in any charts for a process to be deemed statistically controlled.
No identifiable reasons will be identified in a controlled process, and the data will fall inside the control bounds. Several variations with a connected cause are shown here:
- Within-specification variations in material qualities
- Variations in ambient temperature or humidity that occur throughout the year
- Wear and tear on machines and tools
- Manufacturer parameters have a lot of variables
- A reasonable variation in measuring
Special causes, on the other hand, frequently occur outside the realm of control or signify a significant change in the course of the process. Here are a few examples of variance brought on by particular causes:
- Controllers that have blown up
- Misalignments of the equipment
- The measuring system has been changed
- Changes in the process
- Design criteria for raw materials are not met
- For example, tool, punch, or a bit that has been broken
- Unfamiliar with the technique, inexperienced operator
When using statistical process control charts to monitor a process, the inspector will ensure that all data points are contained inside the control limits trends or unanticipated changes.
Let's assume that odd reasons for variance are discovered. If this is the situation, steps should be taken to locate the source of the variation and put remedial measures in place so that the process can once again be controlled statistically.
Changes or patterns in other data points should be noted and looked into within the confines of the control. They include, but are not restricted to:
- There are runs where seven or more consecutive data points cross the process centerline.
- 7 or more data points rising or falling in a continuous pattern
- Changes in the typical spread of data, when several data points become closer or further apart.
- Data shifts that are higher or lower than the typical mean
By addressing any odd causes, trends, or process alterations, we can make sure we're producing components that satisfy the needs of the customer.
Never forget that the control limits need to be placed halfway between the engineer's and the customer's specification limitations.
Data Collection and Documenting
Monitoring of processes or products is how SPC data is gathered.
Depending on the needs for information collection, the information is subsequently documented and tracked on different types of control charts.
Moreover, if you want to gather useful data, you must choose the right chart type. The information can appear as a characteristic or a circle-shaped variable. The gathering and recording of unique values or an averaged set of observations are other options.
Here are some broad principles and examples. This list is not exhaustive and is only meant to serve as a general overview. Furthermore, recent innovations have resulted in some SPC software that can support us in this area.
Outline of Statistical Process Control Tools
Seven tools for quality control in manufacturing and seven extra tools are currently employed in SPC, and they are as follows:
Quality Assurance Procedures
1. Cause and effect diagrams
Cause-and-effect diagrams, often known as Ishikawa diagrams or fishbone diagrams, show the various root causes of an issue. Each branch of the fishbone-shaped diagrams indicates a different category of problems.
2. Check sheets
Check sheets are simple, pre-made forms used to visualize and analyze data that has been collected. When used with data that can be routinely observed and acquired by the same person or area, these worksheets operate best.
3. Control charts
The control chart is the oldest and most popular SPC tool. They support data gathering and anomaly detection, particularly when compared to regular process performances. The charts distinguish between process variations with common cause and those with specific cause.
4. Histograms
Histograms are graphs that show frequency distributions; they often resemble bar charts. When the vast bulk of the data is numerical, they function well.
5. Pareto Diagrams
Pareto analysis charts, which are bar graphs, are used to display time, money, frequency, or cost. They are very helpful in determining how frequently problems happen.
6. Scatter Diagrams
These diagrams show how diverse things are connected to one another. Scatter diagrams or X-Y graphs display pairs of numerical data with one variable on each axis. The most effective scatter diagrams use related numerical data.
7. Stratification
This tool isolates data to make it simpler to find patterns. The division of things, people, and data into tiers or different categories is known as stratification. It is perfect for combining data from many sources.
Additional Resources:
1. Stratification of Data
A variation of the previously discussed stratification
2. Defects Maps
These maps show the locations and kinds of product-related problems, which aid in problem tracking and problem visualization. Every flaw that is discovered is noted on a map.
3. Events log
Circumstance logs are used to centrally and consistently capture important software and hardware events.
4. Process Flowcharts
Diagrams called flowcharts show a process's steps in a logical sequence.
5. Progress Centers
They are a specific type of facility that encourages development. Concentrated areas called "progress centres" are where choices are made, and progress is monitored.
6. Randomization
Randomization assigns the units in question to one of many treatment groups by random.
7. Sample Size Determination
Calculating the Sample Size This tool is used to determine the number of individuals or events that should be included in a statistical analysis.
SPC Manufacturing Implementation Steps that You Need to Follow
The following steps must be taken in order to build up SPC manufacturing, starting with:
1. Selecting the Critical-to-Quality (CTQ) Product Characteristics
In SPC manufacturing, the process of determining the client's requirements and translating those details into quantifiable production and process requirements is referred to as CTQ.
A good example of a CTQ in statistical process control is a chef who make sweet desserts.
The sweetening of the desserts by the baker will be a distinguishing feature of this product.
2. Selecting Your Important Procedures
You can determine if a procedure is crucial or not by determining whether its failure will significantly affect at least one CTQ attribute.
You need to pay close attention to these vital procedures if you want to achieve SPC lean manufacturing.
Again, using the chef as an example, a crucial step may be the requirement to set the pastries' oven temperature before placing them in the oven.
3. Determining Whether Your Machines Are Capable of SPC Calculation Autonomously
Can your production line's machinery or your software for production scheduling assist you in gathering and analyzing SPC data and warning you when things start to spiral out of control?
It will be challenging to spend your time or that of your team members undertaking daily analyses to make sure that production is running well if you're employing ineffective Excel spreadsheets.
4. Discovering What Impacts the Output of Your Processes
Determine what will have an impact on your manufacturing lines and keep an eye on it.
You can use these examples of statistical process control to get started:
Input: Glue is the process input.
Process parameters: fixture and cycle time.
Environment: humidity and temperature.
You'll need to regulate the glue's condition as well as the surrounding humidity.
5. Manage the independent variables you have that have the biggest impact on the result
You must choose how to focus your efforts on influencing these elements in order to achieve this.
This is feasible through on a regular basis gathering data on factors. You determine how much time should pass; or
Teach yourself, your team, and anyone else on the team how to compute and plot data on a chart.
For instance, the most popular SPC tool is often Xbar-R charts. While making this chart, establish the CPK target so that your team members may begin tracking the index's evolution over time.
6. Always look for methods to improve processes.
Your variables are all now apparent thanks to statistical process control charts, therefore the next step is to concentrate on getting rid of them.
You may now assess your production potential using your charts and make adjustments to increase production effectiveness.
7. Keep going
The objective is to implement SPC production over the long term, even though variance may be decreased.
After you accomplish your goal, continue setting new ones while retaining command over the essential production components.
If your process characteristics start to vary, your statistical process control systems will let you know.
Furthermore, you are prepared to move forward once you have completed these steps. However, you should be mindful not to over-tamper with the procedure because making small adjustments continuously will make it unstable.
The seven steps listed above can be used to integrate SPC production into your organization.
Conclusion
A technology called statistical process control enables producers to manage their production processes and anticipate issues. Tragically, the potential advantages are rarely understood, and it is frequently applied improperly.
Businesses that perform assembly today face highly increased competition. The cost of raw materials is still going up. Other factors are beyond a company's control. As a result, companies should focus on ways to enhance process control.
Organizations ought to experiment with continual improvement in terms of competence, quality, and cost cutting. To identify quality issues, many businesses merely undertake post-production reviews.
Furthermore, a company can change from identification-based to anticipation-based quality controls by employing the SPC technique. The administrator can spot patterns or modifications to the procedure before they result in non-adjustable products and scrap by regularly monitoring the process display.
How Deskera Can Assist You?
Want to take your manufacturing venture to the next level?
Then, you're in the right place — Deskera addresses your business resource planning concerns.
Deskera assists manufacturers to stay on top and keep total control of the processes. It helps to increase production, reduce costs, improve effectiveness, and so on.
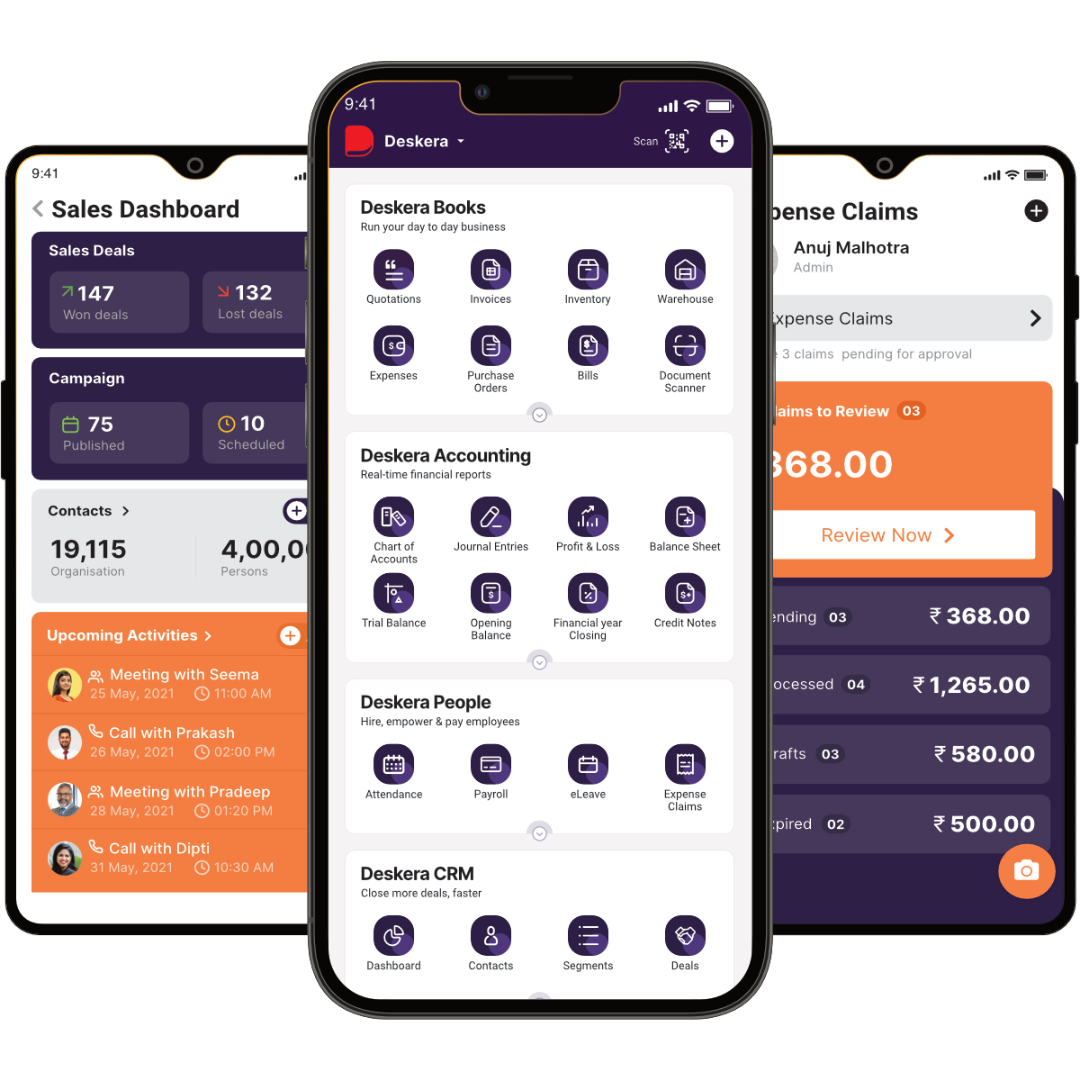
Deskera ERP, a centralized system, has important features like:
- Inventory Management,
- Performance Management
- Order Management,
- End-to-End Quality Management,
- Shop-floor Automation
- Accounting,
- CRM,
- Production Planning & Management, and much more!
So, don't wait anymore-- book a demo for Deskera ERP today!
Final Takeaways
We've arrived at the last section of this guide. Let's have a look at some of the most important points to remember:
- SPC, or statistical process control, is the industry standard for managing and monitoring quality throughout manufacturing processes.
- Many businesses still check the quality of their items after they have been made. By using the SPC technique, a company can transition from detection-based to prevention-based quality management.
- The manufacturing process should be assessed to identify the main waste regions prior to implementing SPC or any other quality system.
- SPC or the adoption of any new quality system. Rework, scrap, and additional inspection time are examples of waste that can occur during the production process.
- Before implementing SPC, a Cross Functional Team (CFT) should conduct a print review or Design Failure Mode and Effects Analysis (DFMEA) exercise to identify the core or essential elements of the design or process.
- When using statistical process control charts to monitor a process, the inspector will ensure that all data points are contained inside the control limits trends or unanticipated changes.
Related Articles