Quality Improvement!
Wouldn’t that become easy if you had some statistical techniques to help you?
Over 80% of problems are caused by a small number (20%) of fundamental causes. The trivial many or the vital few is another name for this technique. Although these numbers aren’t set in concrete, you would identify similar statistics around almost all your work areas.

Being the head of the team, what changes are you trying to bring in to improve the outcomes of the performance? You must have identified the issues in the business that have been bugging you for a while, and there are some issues that need resolution instantly.
Wonder, if you could get a grip of the techniques that helped you identify and fix the problems?
Pareto Analysis might be the solution you are looking for. An easy method that lets you make decisions quickly and helps reduce the impact of the problems. Read on to learn more about Pareto analysis and various important concepts revolving around it.
Here they are:
- What is Pareto Analysis?
- Steps of Pareto Analysis
- Advantages and Disadvantages of Pareto Analysis
- How to Make a Pareto Chart?
- What is Pareto Efficiency?
- Examples of Pareto Analysis
What is Pareto Analysis?
Pareto Analysis is a simple and easy way to arrive at conclusive decisions for analyzing the existing problems and evaluating the impact they could have. As a result, the mechanism facilitates you with concentrating on the solutions that would be most efficient.
Pareto Analysis is derived from the 80/20 Rule or the Pareto Principle introduced by the Italian economist, Vilfredo Pareto.
80% of a project's benefits come from 20% of its effort, according to the Pareto Principle. On the other hand, it is possible to trace 80 percent of problems back to just 20 percent of causes. Using Pareto Analysis, you can identify which problem areas or tasks will yield the best results.
Some examples of this scenario could be:
- 20% staff produces 80% profits
- 20% of defective systems cause 80% issues in operations
- 20% products result in 80% revenue
The process offers a number of benefits, such as:
- Identification and prioritization of problems and tasks
- Aiding in the effective organization of work loads
- Increasing efficiency
- Increasing profits
Steps of Pareto Analysis
Businesses need to analyze the problems they face and the repercussions they may indicate. Based on the 80-20 rule, problems need to be analyzed and solved if they affect profits, cause technical hurdles, delays. There are ratings allotted to these issues on the basis of the revenue they affected, the number of problems that arose, or the time and effort that was lost in the process.
Let’s look at the breakdown of the stages Pareto Analysis entails:
Analyze and List Problems
Put together a list of all the issues you need to resolve. Ask clients and colleagues for their feedback to get a clear understanding of the issues. Among other things, you could also adopt channels such as customer surveys, formal complaints, and help desk logs.
Determine the cause of each issue
The next step is to determine the underlying causes of each issue. You can take the route using useful mechanisms that include Cause and Effect Analysis or the Root Cause Analysis. These tools can be effective in ironing out the lurking issues.
Rank the Problems
You should now rank each problem according to its priority. How you score your problem will vary depending on the nature of the problem. By scoring problems based on how much they cost, you could improve profits. Alternatively, you could look into complaints or customer feedback more often to increase customer engagement and customer satisfaction.
Organize similar problems into one group
You can group problems together by identifying their root causes from the root cause analysis. For instance, if five of your problems are related to your product prices, you can group them together.
Add the results from each group
The next step requires you to add the numbers from each group. Prioritize the group with the highest score, and the one with the lowest score should be your least important.
Get into Action
Now that you have strategized and chalked out things, it is time to implement them. When you solve the problems that have been troubling you, the benefits will likely be greatest, so it is advised that you get into action as soon as possible.
Your lowest-scoring problems might not be worth fixing, especially if they are costly to resolve. Make the most of your Pareto Analysis by conserving resources for what matters most.
Advantages and Disadvantages of Pareto Analysis
Here’s a table that describes the advantages and disadvantages of the Pareto Analysis:
How to Make a Pareto Chart?
A Pareto chart is a visual representation of information that plots the significance of various problems or causes. In a similar manner to a vertical bar graph, it sorts items according to some measurable effect of interest: frequency, cost, or time.
A Pareto chart can be created in the following way:
- On a vertical bar chart, enlist the causes on the x-axis and count or the frequency of occurrences on the y-axis
- The cause with the highest count should be placed first on the bar chart.
- In a descending manner, calculate each cause's cumulative total.
- The cumulative percent for each cause should be calculated in descending order.
- The percentages should descend in increments of 10 from 100% to 0% on the second y-axis.
- On the x-axis, write the cumulative percentage value of each cause.
- Draw a curve by joining the points.
- A line parallel to the x-axis should be drawn at 80% on the y-axis. The line is then dropped at the point where it intersects the curve on the x-axis. This point on the x-axis represents the line segregating the important causes (vital few) from the lesser causes (trivial many).
The Pareto chart can be analyzed by identifying the factors that are most responsible for the complexities. You can do this by identifying a clear break point in the line graph.
When there is no breakpoint, identify the items with a 50% or higher impact. In the absence of a pattern or if the bars seem to be the same height, consider several possible factors that may affect the outcome. In order to see if a pattern emerges, you might want to divide the data into different subgroups and create separate Pareto charts for them.
What is Pareto Efficiency?
Pareto efficiency refers to the phenomenon that states:
There is no way to distribute resources so as to provide more advantages to one individual without making another individual at a disadvantage.
Pareto efficiency refers to the allocation of resources in the most efficient way possible. Despite this, it does not assure equality or impartiality.
Let’s move on to understanding Pareto Analysis through an example.
Pareto Analysis Example
A computer service center has been dealing with a lot of problems of late and the owner aims at increasing customer satisfaction.
Relying on Pareto Analysis, the owner then charts out all the major problems the service center is facing. Along with listing the problems in a tabular format, he also jots down the causes for each of these problems. Having scored the problems, he has a better clarity now.
The owner analyzes and groups the problems, adding the scores for each group. Now, he has figured out the main cause that has led to the highest number of customer complaints.
Lack of Training = 29+20= 49 (item 5 and 6)
Lack of staff = 15+5 = 20 (items 1 and 2)
Poor organization = 3+4 = 7 (items 3 and 4)
Pareto Analysis for the service center will be depicted with this graph:
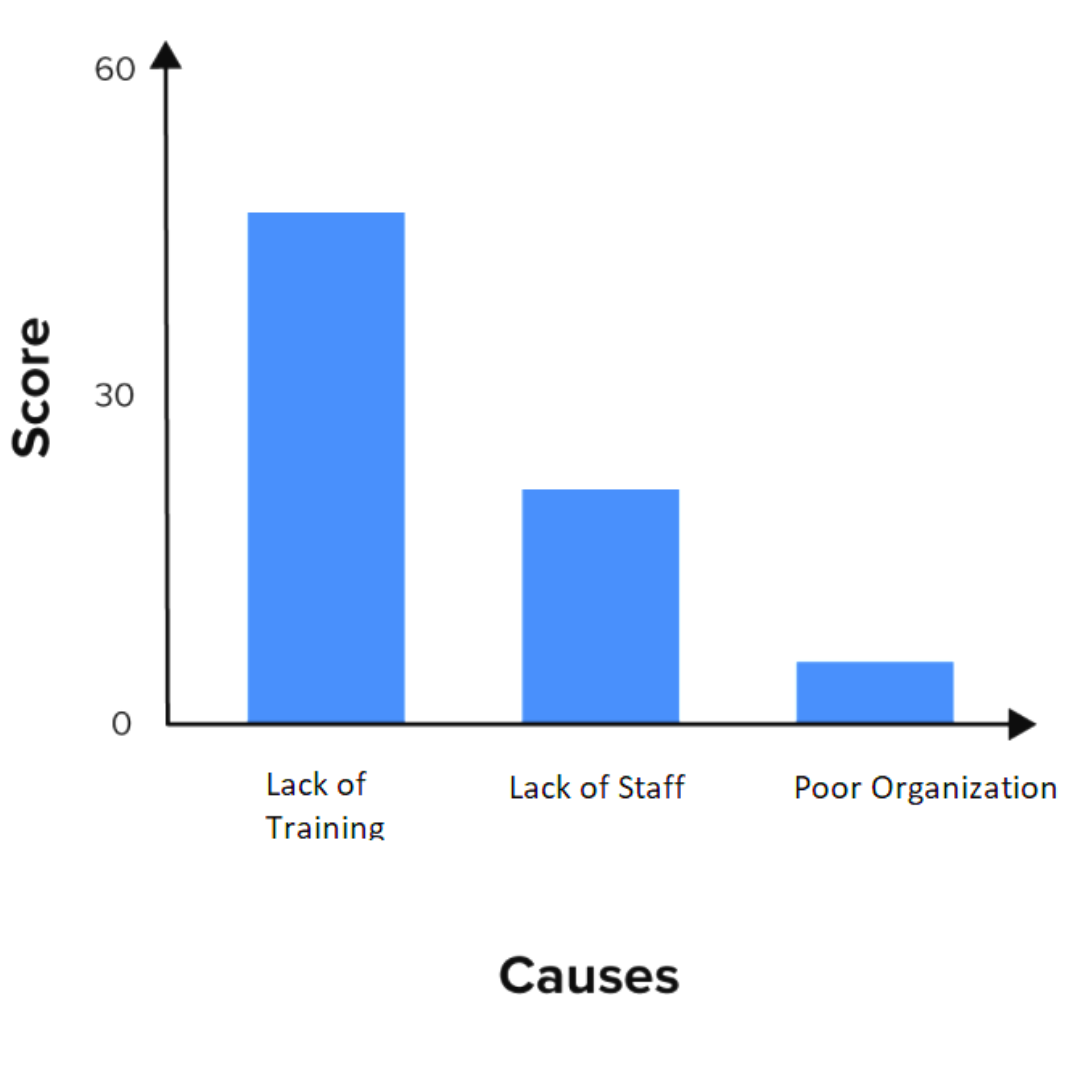
The graph shows that the computer service center will benefit the most when it provides enough training to its staff. Lack of training is the cause which has contributed to customer dissatisfaction the most. Therefore, that is the No.1 problem which needs resolution first.
Next, the owner must hire more efficient staff as lack of staff is the problem that comes a close second. That said, a well-trained staff can compensate well for the lack of staff, too, owing to their multi-tasking abilities.
Conclusion: Pareto’s Analysis has equipped the companies which consistently faced challenges to identify the problems and seek appropriate solutions.
How can Deskera Help You?
Deskera Books is an online accounting, invoicing, and inventory management software that is designed to make your life easy. A one-stop solution, it caters to all your business needs from creating invoices, tracking expenses to viewing all your financial documents whenever you need them.

The platform works exceptionally well for small businesses that need to figure out a lot of things when they are setting out. This delightful software allows them to keep up with the client’s expectations by assisting them in overseeing a timely delivery.

With the well-thought and well-designed templates, you can now anticipate your work to become simpler. These templates can be used for transactions like invoices, quotations, orders, bills, and payment receipts.
If yours is a drop shipping business, you can easily track your orders and create new dropship orders for your suppliers based on the customer orders.
Deskera People is another platform that enables you to expedite and simplify the processes. Through its automated processes like hiring, payroll, leave, attendance, expenses, and more, you can now unburden yourself and focus on the major business activities. It also assists with driving growth for your business by integrated Accounting, CRM & HR Software.
Key Takeaways
Here are the key highlights of the article:
- Pareto Analysis is a simple and easy way to arrive at conclusive decisions for analyzing the existing problems and evaluate the impact they could have.
- Pareto Analysis is derived from the 80/20 Rule or the Pareto Principle introduced by the Italian economist, Vilfredo Pareto.
- The process offers a number of benefits, such as Identification and prioritization of problems and tasks, aiding in the effective organization of work loads, increasing efficiency, and increasing profits.
- Pareto analysis has some minor disadvantages such as relying on the past data to detect problems, no representation of quantitative data, and not providing any solutions, per se.
- Pareto efficiency states that there is no way to distribute resources so as to provide more advantages to one individual without making another individual at a disadvantage.
Related Articles