
What does a high defect rate really cost your business? More than just faulty products—it leads to increased scrap, higher production costs, missed deadlines, and ultimately, lost customer trust. Even a small rise in defects can disrupt operations and erode profitability, making quality control a critical priority for modern businesses.
Defect rate is a key performance metric that measures the proportion of products that fail to meet quality standards. It provides valuable insights into production efficiency, process reliability, and overall operational health. Whether in manufacturing or service delivery, monitoring defect rate helps organizations detect inefficiencies early and maintain consistent output quality.
However, tracking defect rate alone is not enough. Businesses must understand how to calculate it accurately, interpret the data correctly, and take proactive steps to reduce it. Without a structured approach, companies risk relying on incomplete insights, overlooking process gaps, and allowing recurring defects to persist.
This is where solutions like Deskera MRP add tangible value. Deskera MRP enables businesses to implement structured quality control processes with defined quality parameters, checklists, and pass ratings to detect defects early in production.
Deskera MRP also supports production reporting, work order tracking, and scrap management—helping teams monitor performance, identify bottlenecks, and reduce waste. With features like machine maintenance, WIP tracking, and production planning, businesses can address the root causes of defects and continuously improve product quality.
What Is the Defect Rate?
Defect rate is a key quality metric that measures the proportion of products, components, or outputs that contain one or more defects within a defined scope of work. In simple terms, it tells you how frequently errors or quality issues occur during production, development, or service delivery.
It is typically calculated by dividing the total number of defects identified by the total number of units inspected, and then expressing the result as a percentage. This makes it easier for businesses to understand the scale of quality issues and compare performance over time or across different processes.
Defect rate is widely used as a performance indicator because it provides a clear picture of how well a process is functioning. A lower defect rate generally indicates better quality control, while a higher defect rate signals inefficiencies, inconsistencies, or gaps in processes that need attention.
For example, if a company identifies 5 defective units out of 100 produced, the defect rate is 5%. While this may seem small, tracking such metrics consistently helps businesses identify patterns, detect recurring issues, and take corrective actions before defects escalate.
More importantly, defect rate is not just about identifying problems—it’s about enabling continuous improvement. By monitoring defect trends over time, organizations can evaluate the effectiveness of their quality checks, refine processes, and ensure that products consistently meet defined standards.
Factors That Influence Defect Rate
Defect rate is not driven by a single issue—it is the result of multiple interconnected factors across people, processes, materials, and systems.
Understanding these factors helps businesses identify root causes and take targeted actions to improve quality.
1. Workforce Skills and Human Error
Employee expertise plays a major role in maintaining quality standards. Inadequate training, lack of experience, or simple human errors can lead to inconsistencies in production. Even minor mistakes, when repeated, can significantly increase defect rates over time.
2. Machine Performance and Maintenance
Equipment reliability directly impacts product quality. Worn-out machinery, improper calibration, or unexpected breakdowns can result in defects during production. Regular maintenance and timely upgrades are essential to ensure consistent output.
3. Quality of Raw Materials
The quality of inputs determines the quality of outputs. Using substandard or inconsistent raw materials increases the likelihood of defects, regardless of how efficient the production process is. Strong supplier quality management is critical to minimizing this risk.
4. Process Design and Standardization
Poorly designed or non-standardized processes often lead to variability in production. When workflows are unclear or lack consistency, it becomes difficult to maintain uniform quality, resulting in higher defect rates.
5. Quality Control Measures
The effectiveness of inspection and testing processes plays a crucial role. Weak quality checks or delayed inspections can allow defects to pass through unnoticed, increasing the chances of defective products reaching customers.
6. Production Environment
Environmental conditions such as temperature, humidity, and cleanliness can influence product quality, especially in sensitive industries. Uncontrolled environments can introduce defects even when processes are otherwise well-managed.
7. Production Volume and Pressure
High production targets and tight deadlines can sometimes lead to compromised quality. When speed is prioritized over accuracy, the likelihood of errors and defects increases.
By identifying and addressing these influencing factors, businesses can take a proactive approach to quality management, reduce defect rates, and ensure more consistent and reliable outcomes.
How to Calculate Defect Rate
Calculating defect rate is straightforward, but it requires accurate data and a clear definition of what counts as a defect. At its core, defect rate measures the proportion of defective units compared to the total units inspected.
Defect Rate Formula
Defect Rate (%) = (Number of Defective Units ÷ Total Units Inspected) × 100
Step-by-Step Calculation
- Identify the number of defects: Count all units that contain one or more defects within a given period or batch.
- Determine the total units inspected: This includes all items produced, tested, or delivered during the same timeframe.
- Apply the formula: Divide the number of defective units by the total units and multiply by 100 to get a percentage.
Example
If a company inspects 200 units and finds 10 defective ones:
Defect Rate = (10 ÷ 200) × 100 = 5%
This means 5% of the total output did not meet quality standards.
Common Variations of Defect Rate
- Per Unit Basis: Measures defective units out of total units produced
- Per Batch Basis: Calculates defects within a specific production batch
- Defects per Opportunity (DPO): Considers multiple defect opportunities within a single unit
Why Accurate Calculation Matters
A precise defect rate helps businesses track quality performance, compare results over time, and identify areas that need improvement. Inaccurate calculations, on the other hand, can lead to misleading insights and poor decision-making.
Types of Defects in Quality Management
Understanding the different types of defects is essential for accurately measuring defect rate and improving overall quality. Not all defects have the same impact, so classifying them helps businesses prioritize issues and take targeted corrective actions.
1. Minor Defects
Minor defects are small imperfections that do not significantly affect the product’s functionality or usability. These issues are often cosmetic in nature and may go unnoticed by many users. While they don’t disrupt performance, consistently ignoring minor defects can still impact brand perception over time.
2. Major Defects
Major defects affect the product’s performance or usability but may not render it completely unusable. These defects can lead to customer dissatisfaction and may require rework or repair before the product is considered acceptable. Addressing major defects quickly is critical to maintaining quality standards.
3. Critical Defects
Critical defects are the most severe and can make a product unsafe or completely unusable. These defects often lead to product rejection, recalls, or serious customer complaints. They require immediate attention and strict quality control measures to prevent recurrence.
4. Product Defects
Product defects are directly related to the final output. These include issues in design, materials, or workmanship that result in a faulty product. Tracking these defects helps ensure that the end product meets customer expectations and quality benchmarks.
5. Process Defects
Process defects occur due to inefficiencies or errors in the production or operational workflow. These may not always be visible in the final product but can lead to inconsistencies and increased defect rates over time. Identifying process defects is key to long-term quality improvement.
6. Internal Defects
Internal defects are identified before the product reaches the customer, typically during inspection or testing stages. Detecting defects early helps reduce costs associated with returns, repairs, and customer dissatisfaction.
7. External Defects
External defects are discovered after the product has been delivered to the customer. These are the most costly and damaging, as they directly impact customer experience, brand reputation, and potential revenue.
By categorizing defects in this way, businesses can better analyze root causes, prioritize corrective actions, and implement more effective quality control strategies.
Why Use Defect Rate Instead of Raw Counts?
Relying on raw defect counts alone can be misleading. While they tell you how many defects occurred, they don’t provide the full context needed to assess quality accurately. Defect rate, on the other hand, normalizes this data and gives a clearer, more meaningful picture of performance.
1. Enables Fair Comparison
Raw counts don’t account for production volume. For example, 50 defects may seem high, but if they occurred in 10,000 units, the situation is very different than 50 defects in 500 units. Defect rate standardizes this by showing defects as a percentage, making comparisons across time periods, batches, or facilities more accurate.
2. Reflects True Quality Performance
Defect rate links defects to total output, providing a realistic view of process quality. It helps businesses understand whether quality is improving or declining, rather than just tracking fluctuating defect numbers.
3. Supports Better Decision-Making
With defect rate, managers can identify trends, set benchmarks, and make data-driven decisions. Raw counts alone may trigger unnecessary concern or, conversely, hide serious issues when production volume changes.
4. Helps Track Process Improvements
When implementing quality initiatives, defect rate allows you to measure the actual impact. A reduction in defect rate clearly shows improvement, even if total production—and possibly raw defect counts—has increased.
5. Aligns with Industry Standards
Most quality management frameworks and methodologies (like Six Sigma or Lean) rely on normalized metrics such as defect rate rather than raw counts. This makes it easier to benchmark performance against industry standards.
In short, defect rate provides context, clarity, and comparability—turning simple defect data into actionable insights that drive continuous improvement.
Key Benefits of Tracking Defect Rate
Tracking defect rate is essential for maintaining consistent quality and improving overall operational performance. It provides actionable insights that help businesses identify inefficiencies, reduce errors, and continuously enhance their processes.
1. Improves Product Quality
Monitoring defect rate helps businesses detect recurring issues and patterns in production. By identifying the root causes of defects, organizations can implement corrective actions that lead to more consistent and reliable output. Over time, this results in higher product quality, fewer variations, and better adherence to defined standards across all stages of production.
2. Enhances Customer Satisfaction
A lower defect rate directly translates to fewer faulty products reaching customers. This reduces complaints, returns, and negative experiences, helping businesses build trust and credibility. Consistently delivering high-quality products improves customer loyalty and strengthens brand reputation, which is essential for long-term success in competitive markets.
3. Reduces Costs
Defects often lead to additional costs such as rework, scrap, and warranty claims. By tracking defect rate, businesses can identify inefficiencies early and take preventive measures to reduce waste. This not only lowers production costs but also improves overall profitability by minimizing avoidable expenses linked to poor quality.
4. Boosts Operational Efficiency
A well-monitored defect rate highlights inefficiencies and bottlenecks in processes. By addressing these issues, businesses can streamline workflows and ensure smoother operations. Reduced errors mean less time spent on corrections, allowing teams to focus on productivity and achieve higher output with better resource utilization.
5. Enables Data-Driven Decision-Making
Defect rate provides quantifiable insights into quality performance, helping managers make informed decisions. Instead of relying on assumptions, businesses can use accurate data to prioritize improvements, allocate resources effectively, and set realistic quality benchmarks. This leads to more strategic and impactful decision-making.
6. Supports Continuous Improvement
Tracking defect rate over time allows businesses to measure the effectiveness of quality initiatives. It helps teams understand whether implemented changes are delivering results or need further refinement. This ongoing evaluation fosters a culture of continuous improvement, ensuring that processes evolve to meet higher quality standards.
7. Strengthens Compliance and Quality Standards
Maintaining a low defect rate helps businesses meet internal quality benchmarks and external regulatory requirements. Consistent monitoring ensures that processes align with industry standards and reduces the risk of non-compliance. This is particularly important in industries where quality and safety are critical to operations and customer trust.
Strategies to Reduce Defect Rate
Reducing defect rate requires a proactive and structured approach that focuses on improving processes, enhancing visibility, and minimizing variability. The following strategies help businesses consistently deliver high-quality outputs while reducing errors across operations.
1. Implement Strong Quality Control Processes
Establishing clear quality control (QC) and quality assurance (QA) procedures ensures defects are identified early in the production cycle. Standardized inspections, testing protocols, and checkpoints at different stages help catch issues before they escalate. This reduces the likelihood of defective products reaching the final stage or the customer.
2. Standardize Processes and Workflows
Process variability is a major contributor to defects. By creating standardized operating procedures (SOPs), businesses can ensure consistency in how tasks are performed. Clear documentation, defined workflows, and process guidelines reduce ambiguity, improve repeatability, and minimize the chances of errors caused by inconsistent practices.
3. Invest in Employee Training and Skills Development
A well-trained workforce is essential for maintaining quality. Regular training programs help employees understand quality standards, proper handling techniques, and best practices. Skilled workers are less likely to make errors, and they can also identify potential issues early, preventing defects from occurring in the first place.
4. Use Preventive Maintenance for Equipment
Equipment-related issues are a common cause of defects. Implementing a preventive maintenance schedule ensures machines are regularly inspected, calibrated, and serviced. This reduces unexpected breakdowns and performance inconsistencies, leading to more stable production processes and fewer quality issues.
5. Leverage Data and Real-Time Monitoring
Using data-driven tools to monitor production in real time helps detect anomalies as they occur. With better visibility into operations, teams can quickly identify deviations and take corrective action. This reduces the chances of defects spreading across batches and improves overall process control.
6. Conduct Root Cause Analysis
Instead of addressing defects at the surface level, businesses should focus on identifying their root causes. Techniques like the 5 Whys or fishbone diagrams help uncover underlying issues. By resolving the core problem, organizations can prevent recurring defects and improve long-term process stability.
7. Adopt Continuous Improvement Practices
Implementing methodologies like Lean or Six Sigma encourages ongoing evaluation and refinement of processes. Continuous improvement ensures that quality is not treated as a one-time effort but as an ongoing priority. Small, incremental changes over time can significantly reduce defect rates and enhance operational efficiency.
8. Strengthen Supplier Quality Management
Defects often originate from poor-quality raw materials or components. Establishing strict supplier evaluation and quality checks ensures that only high-quality inputs are used in production. Strong collaboration with suppliers also helps maintain consistency and reduces variability in the final output.
By applying these strategies consistently, businesses can move from reactive problem-solving to proactive quality management, significantly reducing defect rates and improving overall performance.
Common Mistakes to Avoid When Managing Defect Rate
Managing defect rate effectively requires more than just tracking numbers—it demands accuracy, consistency, and a focus on continuous improvement. However, many businesses fall into common pitfalls that limit the effectiveness of their quality efforts.
1. Ignoring Root Cause Analysis
One of the biggest mistakes is treating defects as isolated incidents rather than symptoms of deeper issues. Simply fixing defective units without identifying the underlying cause leads to recurring problems. Without proper root cause analysis, businesses end up in a cycle of rework instead of achieving long-term quality improvements.
2. Relying on Inaccurate or Incomplete Data
Defect rate is only as reliable as the data used to calculate it. Inconsistent tracking methods, missing data, or poorly defined defect criteria can lead to misleading insights. This can result in incorrect decisions and missed opportunities for improvement, ultimately impacting overall quality performance.
3. Focusing Only on Output, Not Processes
Many organizations focus solely on final product defects while ignoring inefficiencies in the production process. This reactive approach overlooks the source of the problem. Without evaluating and improving processes, defects will continue to occur, making it difficult to achieve sustainable quality improvements.
4. Lack of Standardized Defect Definitions
When teams do not have a clear and consistent definition of what qualifies as a defect, it creates confusion and inconsistency in reporting. This makes it difficult to compare data across departments or time periods, reducing the reliability of defect rate as a performance metric.
5. Overlooking Minor Defects
Minor defects are often ignored because they do not immediately impact functionality. However, repeated minor issues can accumulate and lead to larger quality problems over time. Ignoring them can also affect customer perception and brand reputation, especially in competitive markets.
6. Infrequent Monitoring and Delayed Action
Tracking defect rate occasionally instead of consistently limits its usefulness. Without regular monitoring, defects may go unnoticed until they become significant issues. Delayed responses can increase costs and make it harder to implement effective corrective actions.
7. Not Aligning Teams on Quality Goals
Quality management is not just the responsibility of one department. When teams are not aligned on quality standards and goals, inconsistencies arise across operations. Lack of collaboration can lead to gaps in accountability and reduce the effectiveness of defect reduction initiatives.
Avoiding these common mistakes helps businesses build a more structured and proactive approach to quality management, ensuring that defect rate becomes a powerful tool for continuous improvement rather than just a reporting metric.
How Deskera MRP Helps You Manage and Reduce Defect Rate
Modern quality management requires more than manual tracking—and this is where Deskera MRP provides practical, built-in capabilities to monitor, control, and reduce defect rates across production.
1. Built-In Quality Control and Inspection Workflows
Deskera MRP allows businesses to define quality parameters, checklists, and pass/fail criteria at multiple stages of production. These structured quality checks ensure that defects are identified early, preventing faulty products from progressing further in the process. This proactive approach significantly reduces overall defect rates.
2. Standardized Quality Parameters and Checklists
The system enables you to create quality groups and assign detailed inspection parameters to products and sub-components. With standardized checklists at the task and work order level, teams can ensure consistency in quality evaluation, reducing variability and human error across operations.
3. Work Order and Production Tracking
Deskera MRP provides real-time visibility into work orders, allowing teams to monitor production progress and quality at each stage. By linking quality checks directly to tasks and workflows, businesses can quickly identify where defects are occurring and take corrective action before issues escalate.
4. Scrap and By-Product Management
Defect rate is closely tied to waste, and Deskera helps track scrap, rejected items, and by-products efficiently. This visibility allows businesses to measure the impact of defects, identify patterns, and implement strategies to minimize waste and improve yield.
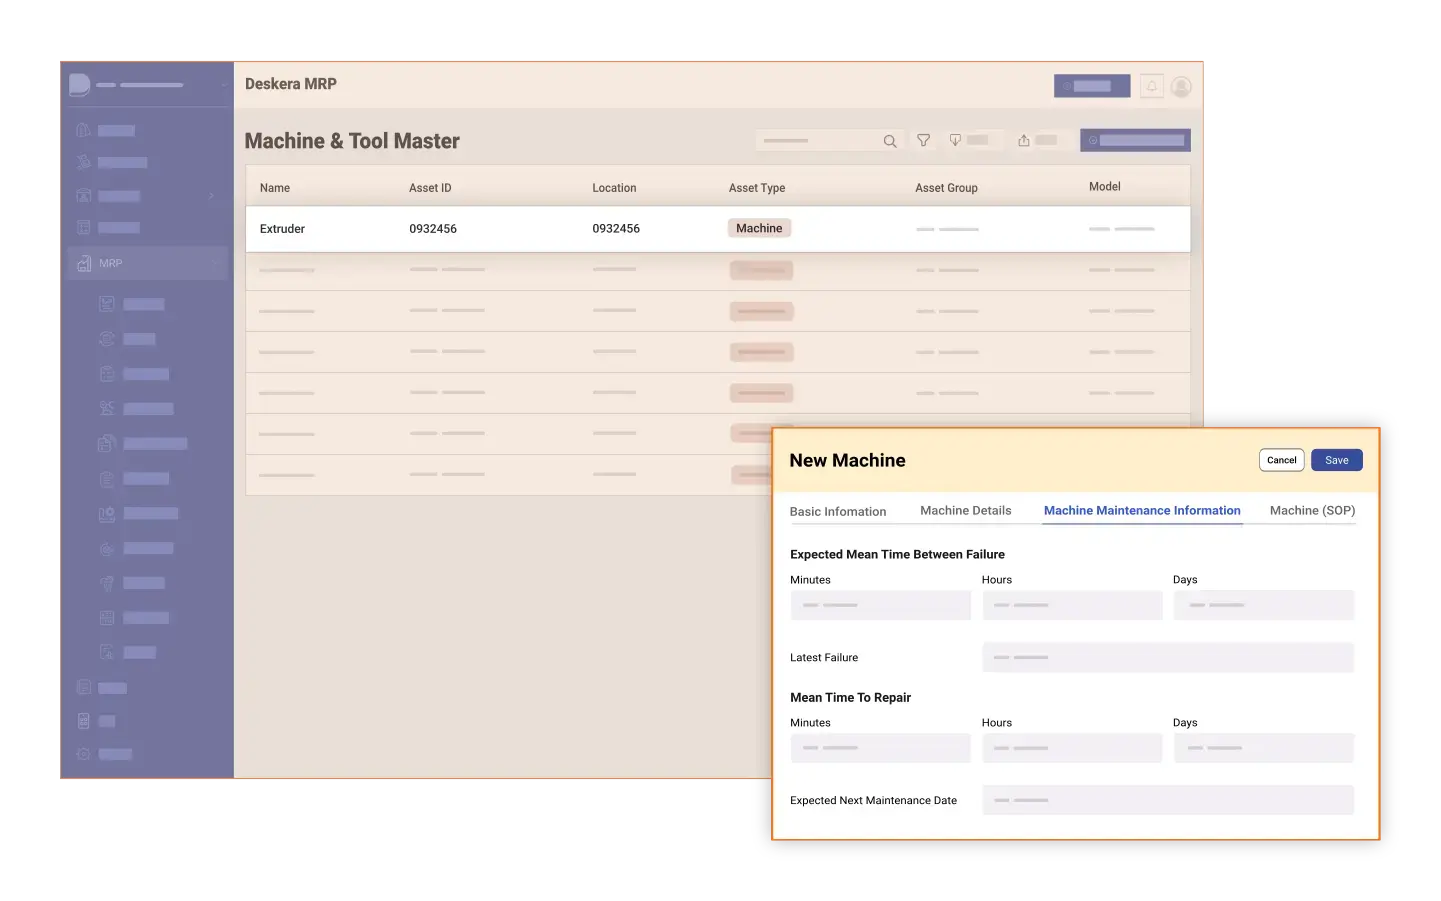
5. Machine Maintenance and Performance Monitoring
Equipment issues are a major source of defects. Deskera MRP includes machine management and maintenance scheduling features that help ensure machines are operating optimally. By reducing downtime and performance inconsistencies, businesses can significantly lower defect occurrence.
6. Production Planning and WIP Tracking
With production planning and work-in-progress (WIP) tracking, Deskera provides complete visibility into manufacturing operations. Businesses can identify bottlenecks, monitor process efficiency, and detect deviations early—helping prevent defects before they impact the final product.
7. Data-Driven Insights and Reporting
Deskera MRP offers production reports and analytics that help businesses evaluate quality performance over time. These insights support better decision-making, enabling teams to identify trends, perform root cause analysis, and continuously improve processes to reduce defect rates.
By combining quality control, production visibility, and data-driven insights, Deskera MRP helps businesses move from reactive defect handling to proactive quality management—ensuring consistent output, reduced waste, and improved operational efficiency.
Key Takeaways
- Defect rate is a critical quality metric that measures the proportion of defective units, helping businesses assess overall process performance.
- Accurate defect rate calculation ensures reliable insights, enabling better tracking, comparison, and decision-making.
- Understanding different types of defects helps prioritize issues and apply targeted quality improvement strategies.
- Multiple factors such as workforce skills, machine performance, and process design directly influence defect rate and must be managed proactively.
- Using defect rate instead of raw counts provides better context, making quality performance easier to evaluate across different production volumes.
- Tracking defect rate consistently improves product quality, reduces costs, and strengthens customer satisfaction.
- Implementing structured strategies like quality control, standardization, and continuous improvement helps reduce defect rates effectively.
- Avoiding common mistakes such as poor data tracking and lack of root cause analysis ensures defect rate remains a reliable metric.
- Deskera MRP supports defect rate management through quality control, production tracking, and actionable insights, enabling continuous quality improvement.
Related Articles