
Are you still relying on basic stock reports to make inventory decisions in 2026? If the answer is yes, you’re not alone—but it may be costing your business more than you realize. Inventory today is no longer just about knowing what’s in the warehouse; it’s about understanding how fast items move, how much capital is tied up, and how inventory performance directly impacts customer satisfaction and profitability. This is where inventory management KPIs move from being “nice to have” to absolutely essential.
In 2026, inventory complexity continues to rise. Demand patterns are less predictable, carrying costs are higher, and customers expect faster, more reliable fulfillment across channels. Without the right KPIs in place, businesses struggle with stockouts, excess inventory, and poor cash flow visibility. Inventory management KPIs provide the clarity needed to measure what’s working, identify risks early, and make informed, data-backed decisions.
However, not all inventory metrics deserve equal attention. Tracking too many numbers without clear purpose often leads to confusion rather than control. The key is to focus on the inventory management KPIs that truly reflect efficiency, accuracy, service levels, and financial health. These KPIs help bridge the gap between inventory operations, finance, and overall business strategy.
This is where modern ERP systems play a critical role. Deskera ERP enables businesses to track inventory management KPIs in real time through centralized data, automated stock updates, and built-in reporting dashboards. With integrated inventory, accounting, and forecasting capabilities, Deskera ERP helps organizations move beyond reactive inventory management and adopt a more proactive, performance-driven approach in 2026.
What Are Inventory Management KPIs?
Inventory Management KPIs, or Key Performance Indicators, are measurable values used to evaluate how effectively a business manages its inventory. These KPIs help organizations monitor critical aspects of inventory performance such as stock movement, demand fulfillment, costs, and process efficiency. Rather than relying on assumptions or static stock reports, inventory KPIs provide data-driven insights that support informed decision-making.
At their core, inventory management KPIs allow businesses to understand how well goods, materials, and finished products flow into warehouses and out to customers. They reveal important patterns related to inventory turnover, sales velocity, demand trends, carrying costs, and stock availability. By tracking these indicators consistently, businesses can assess whether their inventory strategies and workflows are delivering the desired outcomes or need adjustment.
Inventory KPIs are especially valuable because they connect operational performance with financial impact. Metrics such as carrying cost, stockout rate, or inventory accuracy show not only how inventory is handled on the floor but also how it affects cash flow, customer satisfaction, and profitability. When tracked through inventory management systems, KPIs clearly highlight areas of success, inefficiency, and potential risk.
Over time, monitoring inventory management KPIs helps businesses identify trends, benchmark performance against industry standards, and continuously improve inventory practices. By turning raw inventory data into actionable insights, these KPIs play a crucial role in optimizing stock levels, reducing costs, and strengthening overall inventory performance in a competitive business environment.
Why Inventory Management KPIs Are Critical in 2026
Inventory management in 2026 operates in a far more complex and fast-moving environment than ever before. Volatile demand, rising operating costs, and heightened customer expectations leave little room for guesswork. Inventory KPIs provide the visibility and control businesses need to measure performance, anticipate issues, and make timely, data-driven decisions across the supply chain.
Managing Demand Volatility and Uncertainty
Customer demand in 2026 is increasingly unpredictable due to shorter product lifecycles, market fluctuations, and shifting buying behaviors. Inventory KPIs such as forecast accuracy, stockout rate, and inventory turnover help businesses respond quickly to demand changes and avoid both shortages and excess stock.
Controlling Rising Inventory and Holding Costs
Warehousing, storage, insurance, and capital costs continue to rise, making excess inventory more expensive than ever. KPIs like carrying cost of inventory and days inventory outstanding (DIO) allow organizations to closely monitor how much capital is tied up in stock and identify opportunities to improve cash flow efficiency.
Improving Service Levels and Customer Experience
Customers expect faster fulfillment, higher order accuracy, and consistent product availability. Service-related inventory KPIs such as order fill rate and perfect order rate directly measure how well inventory supports customer satisfaction, making them essential for maintaining competitiveness in 2026.
Enabling Data-Driven and Predictive Decision-Making
Manual tracking and historical reporting are no longer sufficient. Inventory KPIs, when powered by real-time data and analytics, enable predictive insights that support proactive replenishment, smarter purchasing, and better production planning. This shift from reactive to predictive management is critical in modern inventory environments.
Aligning Inventory Performance with Business Strategy
Inventory decisions now have a direct impact on financial health, operational resilience, and growth. KPIs help align inventory performance with broader business objectives by linking stock levels, costs, and availability to profitability, working capital management, and long-term strategic goals.
Supporting Automation and ERP-Driven Inventory Management
As businesses increasingly rely on ERP systems and automation, inventory KPIs become the foundation for intelligent workflows and alerts. In 2026, KPIs ensure that automated replenishment, forecasting, and reporting processes are accurate, reliable, and aligned with operational realities.
Categories of Inventory Management KPIs
Inventory management performance cannot be evaluated through a single lens. Different stages of the inventory lifecycle—from purchasing and receiving to storage, fulfillment, and workforce productivity—require different KPIs. Categorizing inventory management KPIs allows leaders to pinpoint problem areas, prioritize corrective actions, and track improvements more effectively across operations.
Sales KPIs
Sales-related inventory KPIs focus on how well inventory supports revenue generation and market competitiveness. These metrics help businesses align inventory availability with sales demand, avoid lost sales due to stockouts, and optimize product mix. When aligned with organizational goals, sales KPIs also help improve forecasting accuracy and sales team effectiveness.
Receiving KPIs
Receiving KPIs, often referred to as warehouse or inbound KPIs, measure how efficiently inventory is received, inspected, and recorded. These KPIs help ensure accurate stock counts from the moment goods arrive, reduce receiving delays, and prevent downstream inventory discrepancies that can disrupt operations.
Operational KPIs
Operational inventory KPIs evaluate how smoothly inventory processes run across storage, picking, packing, and fulfillment. They reveal bottlenecks, inefficiencies, and service-level gaps that affect order accuracy and delivery timelines. Strong operational KPIs are essential for maintaining consistent customer satisfaction.
Employee (Labor) KPIs
Employee or labor KPIs measure workforce productivity and efficiency in inventory-related tasks. These metrics highlight how effectively employees handle inventory operations such as picking, stocking, and cycle counting. Higher employee performance directly translates into faster operations, fewer errors, and lower operating costs.
Financial KPIs
Financial inventory KPIs focus on the cost and cash flow impact of inventory decisions. Metrics in this category help businesses understand how much capital is tied up in stock, how inventory affects profitability, and where cost optimization is possible. These KPIs are critical for balancing service levels with financial health.
Accuracy and Control KPIs
Accuracy-focused KPIs measure how closely system inventory data matches physical stock. These metrics help identify issues related to shrinkage, miscounts, and process gaps. High inventory accuracy is foundational, as inaccurate data undermines the reliability of all other inventory KPIs.
Risk and Resilience KPIs
Risk-related inventory KPIs assess how well a business can withstand disruptions such as supply delays, demand spikes, or supplier failures. These KPIs help organizations build more resilient inventory strategies by highlighting vulnerabilities in safety stock levels, supplier dependency, and replenishment planning.
By organizing inventory management KPIs into clear categories, businesses can gain a holistic view of performance, focus on areas that need immediate attention, and create a more balanced, data-driven inventory strategy for 2026.
27 Inventory Management KPIs You Can’t Ignore in 2026
To manage inventory effectively in 2026, businesses must track KPIs across sales performance, warehouse efficiency, operations, labor productivity, financial impact, data accuracy, and risk preparedness. Each KPI below provides actionable insight into how inventory decisions affect cost control, service levels, and operational resilience.
Sales Inventory KPIs
1. Inventory Turnover Rate
Inventory turnover rate measures how many times inventory is sold and replenished during a specific period, usually annually. It indicates how efficiently inventory aligns with actual demand. Low turnover often signals excess stock or weak sales, while extremely high turnover may increase stockout risk. In 2026, this KPI is essential for balancing service levels with carrying costs and working capital efficiency.
Formula: Inventory Turnover Rate = Cost of Goods Sold ÷ Average Inventory
2. Days Inventory on Hand (DOH)
Days inventory on hand shows how many days current inventory can support sales without additional replenishment. It provides insight into how long capital remains tied up in stock. A high DOH can indicate slow-moving inventory or overstocking, while a very low DOH may expose the business to supply disruptions and missed demand.
Formula: DOH = (Average Inventory ÷ Cost of Goods Sold) × 365
3. Weeks Inventory on Hand (WOH)
Weeks inventory on hand expresses inventory coverage in weeks, making it easier to align with procurement and production planning cycles. This KPI helps businesses assess whether inventory levels are sufficient to meet short-term demand while avoiding excess stock. Monitoring WOH in 2026 supports better synchronization between demand planning, replenishment schedules, and supplier lead times.
Formula: WOH = (Average Inventory ÷ Cost of Goods Sold) × 52
4. Sell-Through Rate
Sell-through rate measures the percentage of inventory received that is sold within a specific time period. It reflects product demand, pricing effectiveness, and purchasing accuracy. A low sell-through rate often signals overbuying or inaccurate demand forecasting, while a high rate indicates strong demand alignment. This KPI is especially valuable for seasonal and fast-moving inventory.
Formula: Sell-Through Rate = (Units Sold ÷ Units Received) × 100
5. Stock-to-Sales Ratio
The stock-to-sales ratio compares the value of inventory on hand to sales generated during the same period. It helps determine whether inventory investment is proportional to revenue performance. A rising ratio may indicate excess inventory or declining sales, while a falling ratio can suggest supply constraints or strong demand momentum.
Formula: Stock-to-Sales Ratio = Inventory Value ÷ Sales Value
6. Lost Sales Rate
Lost sales rate measures the percentage of demand that could not be fulfilled due to inventory unavailability. It highlights the direct revenue impact of stockouts and poor replenishment planning. In 2026, tracking this KPI is critical for protecting customer satisfaction and market share in environments with high competition and short delivery expectations.
Formula: Lost Sales Rate = (Lost Sales ÷ Total Demand) × 100
Receiving and Warehouse KPIs
7. Receiving Cycle Time
Receiving cycle time measures the total time required to inspect, verify, and record incoming inventory before it becomes available for storage or sale. Longer receiving times delay inventory visibility and disrupt downstream operations. Reducing this KPI improves warehouse efficiency, accelerates order fulfillment, and enhances inventory accuracy across systems.
Formula: Receiving Cycle Time = Total Receiving Time ÷ Number of Receipts
8. Put-away Time
Put-away time tracks how long it takes to move inventory from the receiving area to its assigned storage location. Faster put-away improves inventory availability, reduces congestion, and minimizes handling errors. In 2026, this KPI is essential for high-throughput warehouses aiming to support same-day or next-day fulfillment expectations.
Formula: Put-away Time = Total Put-away Time ÷ Units Put Away
9. Warehouse Space Utilization
Warehouse space utilization measures how effectively available storage capacity is being used. Poor utilization can result in overcrowding, inefficient picking paths, or wasted space, all of which increase operational costs. Monitoring this KPI helps optimize layout planning, slotting strategies, and long-term warehouse expansion decisions.
Formula: Warehouse Space Utilization = Used Storage Space ÷ Total Available Space × 100
10. Supplier Quality Index (SQI)
Supplier quality index evaluates supplier performance across multiple dimensions, including material quality, delivery reliability, responsiveness, and corrective actions. It helps identify suppliers that introduce risk into inventory operations. In 2026, SQI supports stronger supplier relationships and reduces disruptions caused by late deliveries or substandard materials.
Formula (example): SQI = Weighted Score of Quality, Delivery, Responsiveness, and Compliance
Operational Inventory KPIs
11. Order Fulfillment Rate
Order fulfillment rate measures the percentage of customer orders fulfilled completely and on time using available inventory. It directly reflects inventory availability and process efficiency. A declining fulfillment rate often points to forecasting errors, replenishment delays, or inaccurate stock data, making it a critical service-level KPI in 2026.
Formula: Order Fulfillment Rate = (Orders Fulfilled ÷ Total Orders) × 100
12. Perfect Order Rate
Perfect order rate measures the percentage of orders delivered without delays, errors, damage, or documentation issues. This KPI provides a holistic view of inventory and fulfillment performance from the customer’s perspective. Improving perfect order rate in 2026 requires accurate inventory data, efficient warehouse execution, and reliable logistics coordination.
Formula: Perfect Order Rate = (Perfect Orders ÷ Total Orders) × 100
13. Stockout Rate
Stockout rate tracks how frequently products are unavailable when customers attempt to purchase them. High stockout rates lead to lost revenue and reduced customer loyalty. Monitoring this KPI helps businesses fine-tune safety stock levels, improve demand forecasting, and maintain consistent service levels in volatile markets.
Formula: Stockout Rate = (Stockout Events ÷ Total Demand Events) × 100
14. Backorder Rate
Backorder rate measures the percentage of customer orders that cannot be fulfilled immediately due to insufficient inventory. Persistent backorders often signal supply-demand imbalance or supplier delays. In 2026, reducing this KPI is essential for maintaining trust with customers and preventing operational bottlenecks.
Formula: Backorder Rate = (Backordered Orders ÷ Total Orders) × 100
Employee (Labor) Inventory KPIs
15. Inventory Productivity per Employee
Inventory productivity per employee measures how much inventory volume or how many orders each employee processes within a given period. It helps assess workforce efficiency and staffing effectiveness across inventory operations. Low productivity may indicate poor training, inefficient layouts, or process bottlenecks. In 2026, this KPI is critical as labor costs rise and automation and human work must be balanced carefully.
Formula: Inventory Productivity = Units Processed ÷ Number of Employees
16. Picking Accuracy Rate
Picking accuracy rate measures how often employees select the correct items and quantities during order fulfillment. High accuracy reduces returns, rework, customer complaints, and operational waste. A declining picking accuracy rate often points to issues with training, labeling, slotting, or inventory data quality. Maintaining high accuracy is essential for service reliability in fast-paced fulfillment environments.
Formula: Picking Accuracy Rate = (Correct Picks ÷ Total Picks) × 100
17. Labor Cost per Order
Labor cost per order tracks the total workforce expense associated with fulfilling a single customer order. It helps businesses understand how staffing decisions, automation, and process improvements affect fulfillment costs. Rising labor cost per order may signal inefficiencies or overstaffing, while overly low costs may impact service quality.
Formula: Labor Cost per Order = Total Labor Cost ÷ Orders Fulfilled
18. Cycle Count Completion Rate
Cycle count completion rate measures how consistently scheduled inventory counts are completed on time. Regular cycle counting improves inventory accuracy and reduces reliance on disruptive physical stock counts. In 2026, this KPI supports audit readiness, shrinkage control, and reliable inventory data for planning and replenishment decisions.
Formula: Cycle Count Completion Rate = (Completed Counts ÷ Scheduled Counts) × 100
Financial Inventory KPIs
19. Inventory Carrying Cost
Inventory carrying cost measures the total expense of holding inventory, including storage, capital, insurance, obsolescence, and handling costs. High carrying costs reduce profitability and tie up working capital. Tracking this KPI helps businesses optimize stock levels without compromising service levels, especially in high-interest and inflationary environments.
Formula: Inventory Carrying Cost (%) = (Total Holding Costs ÷ Total Inventory Value) × 100
20. COGS-to-Inventory Ratio
COGS-to-inventory ratio evaluates how efficiently inventory investment is converted into actual sales. A higher ratio indicates stronger inventory utilization, while a lower ratio suggests excess stock or slow-moving items. This KPI is useful for assessing inventory performance from a financial efficiency perspective.
Formula: COGS-to-Inventory Ratio = Cost of Goods Sold ÷ Average Inventory
21. Inventory Turnover Value
Inventory turnover value measures how much revenue is generated for every unit of inventory investment. It connects inventory decisions directly to profitability and growth. Tracking this KPI helps businesses evaluate whether inventory levels are supporting revenue objectives without excessive capital lock-in.
Formula: Inventory Turnover Value = Revenue ÷ Average Inventory Value
Inventory Accuracy and Control KPIs
22. Inventory Accuracy Rate
Inventory accuracy rate compares system-recorded inventory quantities with physically counted stock. High accuracy is foundational for reliable forecasting, replenishment, and order fulfillment. Poor accuracy leads to stockouts, overstocking, and planning errors. In 2026, accurate inventory data is critical for automation and ERP-driven decision-making.
Formula: Inventory Accuracy Rate = (Accurate Records ÷ Total Records) × 100
23. Inventory Shrinkage Rate
Inventory shrinkage rate measures losses caused by theft, damage, administrative errors, or fraud. It directly impacts profitability and inventory reliability. Monitoring this KPI helps businesses identify control weaknesses and implement corrective actions such as tighter processes, audits, or security measures.
Formula: Inventory Shrinkage Rate = (Recorded Inventory − Physical Inventory) ÷ Recorded Inventory × 100
24. Inventory Adjustment Frequency
Inventory adjustment frequency tracks how often inventory records require corrections. Frequent adjustments indicate systemic issues such as poor receiving practices, inaccurate picking, or weak controls. Reducing this KPI improves trust in inventory data and stabilizes downstream planning and reporting processes.
Formula: Inventory Adjustment Frequency = Number of Adjustments ÷ Total Inventory Transactions
Risk and Resilience Inventory KPIs
25. Safety Stock Coverage
Safety stock coverage measures how long safety stock can sustain operations during supply disruptions or demand spikes. It helps businesses balance resilience with carrying cost control. In 2026, this KPI is essential for managing uncertainty without overinvesting in excess inventory.
Formula: Safety Stock Coverage = Safety Stock ÷ Average Daily Demand
26. Supplier Lead Time Variability
Supplier lead time variability tracks fluctuations between expected and actual supplier delivery times. High variability increases stockout risk and complicates replenishment planning. Monitoring this KPI helps businesses identify unreliable suppliers and adjust safety stock or sourcing strategies accordingly.
Formula: Lead Time Variability = Actual Lead Time − Average Lead Time
27. Obsolete Inventory Rate
Obsolete inventory rate measures the proportion of inventory that is expired, damaged, or no longer sellable. High obsolescence ties up capital and increases write-offs. Tracking this KPI helps businesses improve forecasting, lifecycle planning, and inventory rotation strategies.
Formula: Obsolete Inventory Rate = Obsolete Inventory ÷ Total Inventory × 100
How to Choose the Right Inventory Management KPIs to Track
Selecting the right inventory management KPIs is as important as tracking them. In 2026, businesses must focus on KPIs that deliver clarity, drive action, and align inventory decisions with broader business objectives. Rather than measuring everything, the goal is to track the metrics that genuinely improve performance and outcomes.
Align KPIs with Strategic Business Goals
Start by identifying what your business is trying to achieve, whether it is improving cash flow, reducing stockouts, increasing service levels, or supporting growth. Inventory KPIs should directly support these objectives. Tracking metrics that do not move the business toward its strategic goals often leads to wasted effort and unclear decision-making.
Use SMART Criteria for KPI Selection
Effective inventory KPIs should be specific, measurable, achievable, relevant, and timely. SMART KPIs ensure that performance can be clearly measured and acted upon. Vague or overly complex metrics make it difficult to identify improvement opportunities or assess whether inventory initiatives are successful.
Focus on Areas That Need Improvement
Not all parts of the inventory process require the same level of attention. Prioritize KPIs that address known problem areas, such as frequent stockouts, excess inventory, low accuracy, or rising carrying costs. KPIs should highlight gaps and risks, not simply confirm what is already working well.
Limit the Number of KPIs Tracked
Tracking too many KPIs can overwhelm teams and dilute focus. It is more effective to start with a small, well-defined set of KPIs for each functional area, such as sales, warehouse, operations, or finance. As teams become comfortable using KPIs, additional metrics can be introduced gradually.
Ensure KPIs Are Actionable
Every inventory KPI should lead to clear actions. If a metric does not indicate what needs to change or how teams can respond, it offers limited value. Before finalizing a KPI, assess whether staff can realistically influence the outcome and whether processes exist to act on the insights generated.
Involve Department Managers and Teams
Inventory KPIs should not be defined in isolation. Collaborate with department managers to understand how KPIs will affect daily tasks and workflows. This helps ensure that metrics improve effectiveness, not just efficiency, and that teams understand how their actions influence performance outcomes.
Balance Efficiency with Effectiveness
Some KPIs improve speed or cost reduction but may negatively affect service quality or accuracy. Choose KPIs that balance efficiency with effectiveness, ensuring that inventory processes support customer satisfaction, reliability, and long-term performance rather than short-term gains alone.
Consider the Impact on Collaboration and Behavior
KPIs influence how teams behave. Poorly chosen metrics can create unhealthy competition or discourage collaboration between departments. Select KPIs that promote shared accountability across procurement, warehouse, sales, and finance teams, rather than siloed optimization.
Ensure Alignment with Mission and Culture
Inventory KPIs should reflect the organization’s mission, values, and operating model. Metrics that conflict with company culture or priorities are unlikely to gain long-term adoption. Alignment ensures KPIs are embraced as performance tools rather than compliance requirements.
Review and Refine KPIs Regularly
Inventory environments change constantly due to market conditions, supply chain risks, and business growth. The right KPIs today may not remain relevant tomorrow. Regularly review KPI effectiveness, retire metrics that no longer add value, and refine targets to support continuous improvement.
By choosing inventory management KPIs thoughtfully, businesses can ensure that measurement leads to meaningful insight, better decisions, and sustained inventory performance improvement in 2026 and beyond.
Benefits of Tracking Inventory Management KPIs
Tracking inventory management KPIs delivers far more than operational visibility. In 2026, these metrics play a strategic role in improving efficiency, financial performance, and customer satisfaction. When used consistently, inventory KPIs help organizations move from reactive stock control to proactive, insight-driven inventory management.
Improved Inventory Visibility and Control
Inventory KPIs provide real-time insight into stock levels, movement, and availability across locations. This visibility helps businesses maintain tighter control over inventory, reduce blind spots, and ensure that decision-makers are working with accurate, up-to-date data rather than assumptions or outdated reports.
Better Cash Flow and Working Capital Management
KPIs such as inventory turnover, days inventory on hand, and carrying cost highlight how much capital is tied up in stock. Tracking these metrics helps businesses reduce excess inventory, free up working capital, and reinvest cash into growth-focused initiatives without compromising service levels.
Reduced Stockouts and Excess Inventory
Inventory KPIs help strike the right balance between availability and cost. Metrics like stockout rate, safety stock coverage, and forecast accuracy enable businesses to prevent lost sales caused by shortages while avoiding the financial burden of overstocking and obsolescence.
Enhanced Forecasting and Demand Planning
By tracking historical performance and demand-related KPIs, businesses can refine forecasting models and replenishment strategies. Over time, this leads to more accurate demand planning, smoother procurement cycles, and better alignment between sales, operations, and inventory planning.
Higher Operational Efficiency
Warehouse, receiving, and labor KPIs reveal inefficiencies in inventory handling, storage, and fulfillment processes. Monitoring these metrics enables businesses to identify bottlenecks, improve workflows, optimize layouts, and increase overall productivity without increasing headcount.
Improved Customer Satisfaction and Service Levels
Inventory KPIs such as order fulfillment rate and perfect order rate directly impact customer experience. Consistently tracking and improving these metrics leads to faster deliveries, fewer errors, and higher order reliability, which strengthens customer trust and loyalty.
Data-Driven Decision-Making
Inventory management KPIs replace intuition with measurable insights. Leaders can evaluate the impact of process changes, supplier decisions, or demand shifts using objective data, enabling faster, more confident decision-making across inventory operations.
Stronger Supplier and Risk Management
KPIs related to supplier performance and lead time variability help businesses identify supply chain risks early. This allows organizations to adjust sourcing strategies, renegotiate supplier terms, or increase resilience against disruptions before they impact operations.
Continuous Improvement and Performance Benchmarking
Tracking inventory KPIs over time makes it easier to identify trends, benchmark performance against industry standards, and measure progress. This supports a culture of continuous improvement, where inventory processes evolve alongside business needs and market conditions.
By consistently tracking inventory management KPIs, organizations gain the insight needed to reduce costs, improve service reliability, and build a more agile and resilient inventory strategy for 2026 and beyond.
Challenges of Tracking Inventory Management KPIs
While inventory management KPIs are essential for operational efficiency and strategic decision-making, tracking them effectively comes with several challenges. Understanding these obstacles helps businesses design better systems and processes to ensure KPIs deliver real value.
Data Accuracy and Integrity
Reliable KPIs depend on accurate, up-to-date inventory data. Manual data entry errors, delayed updates, or inconsistencies across multiple systems can lead to misleading metrics. Without data integrity, decisions based on KPIs may result in overstocking, stockouts, or misallocation of resources.
Overwhelming Number of Metrics
Organizations often try to track too many KPIs at once, which can confuse teams and dilute focus. Selecting relevant KPIs that align with strategic goals is crucial. Overloading staff with metrics can reduce engagement and make it difficult to act on insights effectively.
Integration Across Systems
Inventory data is often spread across ERP systems, warehouse management software, and procurement platforms. Ensuring these systems integrate seamlessly is challenging but necessary to generate a holistic view of KPIs and avoid fragmented reporting.
Lack of Standardization
Different departments may define the same KPI differently, such as “inventory turnover” or “stockout rate.” Without standardized definitions and calculations, KPI comparisons across teams or locations become unreliable and hinder decision-making.
Difficulty in Linking KPIs to Actionable Insights
Some KPIs provide numbers but not guidance on next steps. For example, knowing that carrying costs are high doesn’t automatically tell teams how to reduce them. Translating KPI trends into actionable strategies requires expertise and context.
Resistance to Change
Introducing new KPIs can disrupt existing workflows. Staff may resist tracking additional metrics or feel evaluated unfairly, especially if the KPIs affect performance reviews. Change management and clear communication are essential to overcome resistance.
Dynamic Business Environments
KPIs that were relevant last quarter may become outdated due to market changes, seasonality, or new product lines. Continuously reviewing and adjusting KPIs ensures they remain aligned with business objectives.
Resource Constraints
Tracking KPIs requires time, tools, and skilled personnel. Small or growing businesses may lack dedicated analytics teams or advanced inventory software, making consistent KPI monitoring a challenge.
By acknowledging these challenges, businesses can implement strategies, processes, and tools—like Deskera ERP—to ensure inventory KPIs are accurate, actionable, and aligned with organizational goals.
Best Practices for Tracking Inventory Management KPIs
Tracking inventory management KPIs effectively requires more than just collecting data—it involves careful planning, alignment with business goals, and ongoing monitoring. Adopting best practices ensures your KPIs are actionable, relevant, and drive continuous improvement across your operations.
Choose Relevant Metrics
Start by selecting KPIs that directly impact your business goals. Limit the number of KPIs per functional area to 5–7 to avoid overwhelming staff. Focus on metrics that measure areas needing real improvement, such as inventory turnover, order accuracy, or warehouse utilization. Each KPI should be SMART: specific, measurable, achievable, relevant, and time-bound.
Establish Clear Definitions and Benchmarks
Define each KPI clearly and document how it is calculated. Standardization ensures consistency across departments and locations. Set realistic benchmarks based on historical performance, industry standards, and strategic objectives. This gives your team a clear target and helps identify deviations requiring corrective action.
Implement Robust Data Collection Systems
Ensure accurate and timely data by integrating ERP, warehouse management, and supply chain systems. Use tools like barcode scanners, RFID tags, or automated inventory software to reduce errors. Centralizing data in a single system provides a comprehensive view of inventory KPIs and facilitates easier monitoring.
Provide Staff Training and Buy-In
Communicate the purpose and importance of each KPI to your team. Train employees on how to track, interpret, and act on the data. Ensure workflow processes support KPI achievement, and encourage collaboration rather than unhealthy competition. Staff buy-in increases engagement and accountability.
Monitor and Review Regularly
Regularly review KPI performance to identify trends, gaps, and opportunities. Use dashboards and visualization tools to simplify reporting. Conduct audits and adjust targets as necessary to reflect changes in business goals, market conditions, or technology. Continuous review ensures KPIs remain relevant and actionable.
Align KPIs with Strategic Goals
KPIs should reflect your company’s overall strategy. For example, if the goal is cost efficiency, focus on carrying costs and supplier performance. If customer satisfaction is a priority, track order fill rates, delivery accuracy, and fulfillment speed. Alignment ensures KPIs drive decisions that support broader business objectives.
Automate Reporting and Analysis
Leverage dashboards and automated reporting tools to track KPI progress in real time. Automation reduces manual errors, saves time, and provides actionable insights quickly. Customizable dashboards can highlight critical KPIs and provide instant alerts when thresholds are crossed.
Take Action on Insights
KPIs are only valuable if they inform decisions. Use the insights gained to optimize inventory levels, reduce carrying costs, improve fulfillment rates, and enhance overall operational efficiency. Adjust processes and strategies based on KPI trends to maintain continuous improvement.
Following these best practices ensures that your inventory management KPIs are not just numbers on a screen but powerful tools that guide actionable decisions, optimize inventory, and drive business growth.
How Deskera ERP Helps Track and Optimize Inventory Management KPIs
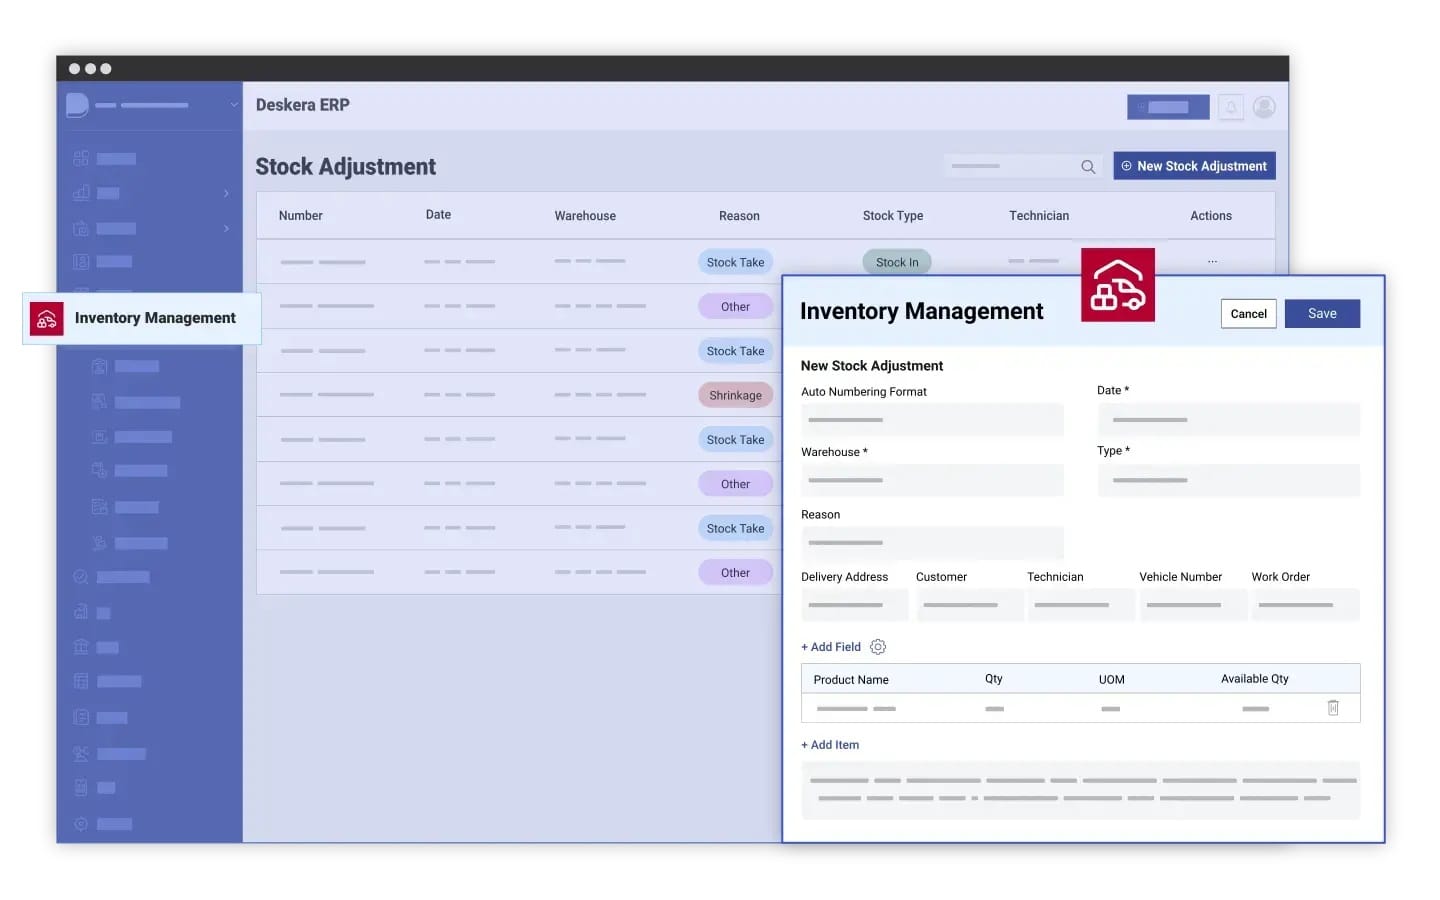
Deskera ERP is a comprehensive solution that empowers businesses to monitor, analyze, and optimize inventory management KPIs in real time. By centralizing inventory data and automating processes, it allows managers to make informed decisions, reduce costs, and improve operational efficiency. Here’s how Deskera ERP supports KPI tracking and optimization:
Real-Time Inventory Tracking
Deskera ERP provides real-time visibility into stock levels across multiple warehouses and locations. By automatically updating inventory quantities with every transaction, managers can track critical KPIs such as inventory turnover ratio, stockout rates, and days in inventory without manual intervention.
Automated Reporting and Dashboards
The platform offers customizable dashboards that display key inventory metrics at a glance. Managers can monitor trends, identify slow-moving stock, and evaluate fulfillment performance. Reports can be tailored to highlight metrics most relevant to business goals, enabling timely decision-making and proactive inventory adjustments.
Streamlined Purchase Order Management
With Deskera ERP, procurement processes are automated, ensuring timely reordering and minimizing stockouts or excess inventory. This directly impacts KPIs such as order fill rate, lead time variance, and inventory accuracy by aligning purchase orders with actual demand patterns.
Integration Across Business Functions
Deskera ERP integrates inventory management with accounting, sales, and production planning. This unified approach allows KPI analysis to consider multiple factors, such as carrying costs, cost of goods sold, and demand forecasts, ensuring a comprehensive view of inventory performance.
Alerts and Notifications
Managers receive instant alerts when inventory levels fall below thresholds or when KPIs deviate from set benchmarks. This feature allows for quick corrective action, preventing stockouts, overstocking, and operational delays, thereby improving overall supply chain efficiency.
Data-Driven Insights and Forecasting
Deskera ERP leverages historical data to generate insights and predictive analytics. By analyzing trends, it helps managers optimize reorder points, reduce excess inventory, and improve turnover rates. This ensures that KPIs like inventory accuracy, days in inventory, and carrying cost remain within target ranges.
Enhanced Compliance and Audit Trails
Every transaction in Deskera ERP is logged, creating a complete audit trail. This ensures accurate measurement of KPIs such as stock discrepancies, shrinkage, and cycle counts. Accurate tracking builds accountability and supports continuous improvement initiatives.
By centralizing inventory data, automating processes, and providing actionable insights, Deskera ERP makes KPI tracking simple, accurate, and actionable. Businesses can align inventory operations with strategic goals, improve decision-making, and drive overall efficiency and growth.
Key Takeaways
- Inventory management KPIs are measurable metrics that help businesses monitor, evaluate, and optimize their inventory processes to improve efficiency, reduce costs, and support strategic goals.
- KPIs can be categorized into operational, financial, and service-oriented metrics, each offering insights into inventory performance, cost control, and customer satisfaction.
- Select KPIs that are SMART (specific, measurable, achievable, relevant, and timely), aligned with business objectives, actionable by teams, and focused on areas that need real improvement.
- Monitoring KPIs improves decision-making, reduces stockouts and excess inventory, optimizes cash flow, and ensures that inventory operations support overall business growth.
- Common challenges include data accuracy issues, selecting the right metrics, balancing too many KPIs with actionable insights, and ensuring team adoption without overwhelming staff.
- Establish clear goals, limit KPIs to the most relevant metrics, automate data collection, provide training and dashboards, integrate systems, and regularly review benchmarks to drive continuous improvement.
- Deskera ERP centralizes inventory data, automates reporting, provides real-time insights, streamlines procurement, integrates with other business functions, and ensures accurate tracking for better decision-making and KPI optimization.
Related Articles