
Have you faced any difficulty in deciding what to build as a product manager? If the answer is yes, fret not. You have landed at the right place. The product management prioritization framework is something that can help you. It will help you narrow down what you require for the initial version of the product and help you to make data-driven decisions quickly. Read on to know more about product management prioritization frameworks.
What is Prioritization in Product Management?
The process of evaluating the relative importance of work in a disciplined manner is known as prioritization. This is done to eradicate inefficient practices and deliver customer value in the quickest way possible. Product prioritization is not only about putting certain features in a certain order but also about evaluating multiple inputs and opinions of stakeholders. To streamline this complex decision-making process, AI tools for product management help teams organize priorities and ensure that every decision aligns with customer needs and overall business goals.
What are Product Prioritization Frameworks?
Prioritizing a roadmap without market research is the biggest challenge that product managers face because of shifting of priorities, reallocation of resources, and scarcity of funding. According to a survey, around 49% of people admitted that they face difficulty in prioritizing new features and products without valuable customer feedback. They aren’t sure whether they are going on the right track or not. This is where product prioritization frameworks step in!
Product prioritization frameworks are a set of principles that help you to decide what to work on next. They are a scientific way to prioritize work in an efficient manner. Prioritization frameworks help you to prioritize work, optimize your cross-functional team’s workflows to assess whether any initiative is worth your company or not.
Let’s take a look at some of the most popular product prioritization frameworks:
Value vs Complexity
This framework provides product teams with an objective way to determine which initiatives to prioritize in order to succeed. Value vs Complexity acts as a prioritization instrument and is simply a 2X2 grid matrix with ‘value’ plotted against ‘complexity’.
The value and complexity of each feature have to be quantified if you want to make this framework work.
Value: Value refers to the profit your customers and your business get out of the feature. It helps to determine whether the feature is going to solve any customers’ problems, enhance their day-to-day workflow, or help them attain the desired outcome.
Complexity: Complexity refers to the efforts that need to be put in by your organization to provide this feature. Simply, creating a feature that your customers love is not enough. The feature or product should be aligned according to your business. While determining complexity, you will have to consider some factors such as operational costs, development time, skills, training, technology, and infrastructure costs.
In case, you can grab more value with fewer efforts, that’s a feature you should prioritize.
Value/Complexity = Priority
When combined together, the criteria make up several quadrants which are mentioned below:
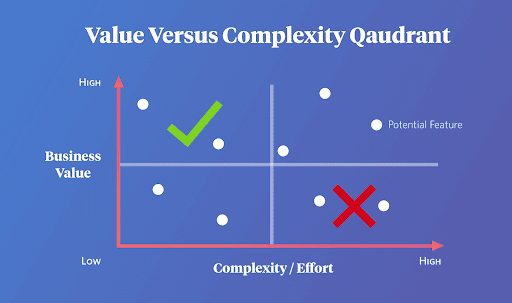
Upper-left Quadrant: This refers to the ‘quick wins’ quadrant and includes high value and low complexity. Thus, features which fall in this category should be executed on top priority.
Upper Right Quadrant: The features that lie in this quadrant refer to the big projects that are valuable but are too risky to execute because of the resources and costs associated with them.
Lower-Left Quadrant: In this quadrant, usually ‘fill-ins’, ‘maybes’, or ‘nice to have’ features are included.
Lower-Right Quadrant: In this quadrant, time sinks features are included which means the features that cannot be included in the product.
If your team is working on new products, The Value vs. Complexity Quadrant is an excellent framework to implement. With this framework, you can make fast objective decisions. Also, you can easily identify low-hanging fruit opportunities with this model.
The drawback of this framework is that it can get quite messy if you are working on a product with a long list of features.
The Kano Model
The Kano Model was developed by Japanese professor Noriako Kano and his team in 1984. This model is a set of guidelines and techniques that focuses on categorizing and prioritizing customer needs, enhancing product development, and improving customer satisfaction.
The Kano model enables you to gauge the features from the point of view of the customers. This implies that it should determine how well the feature is implemented according to the customer’s perception.
The model contains two dimensions:
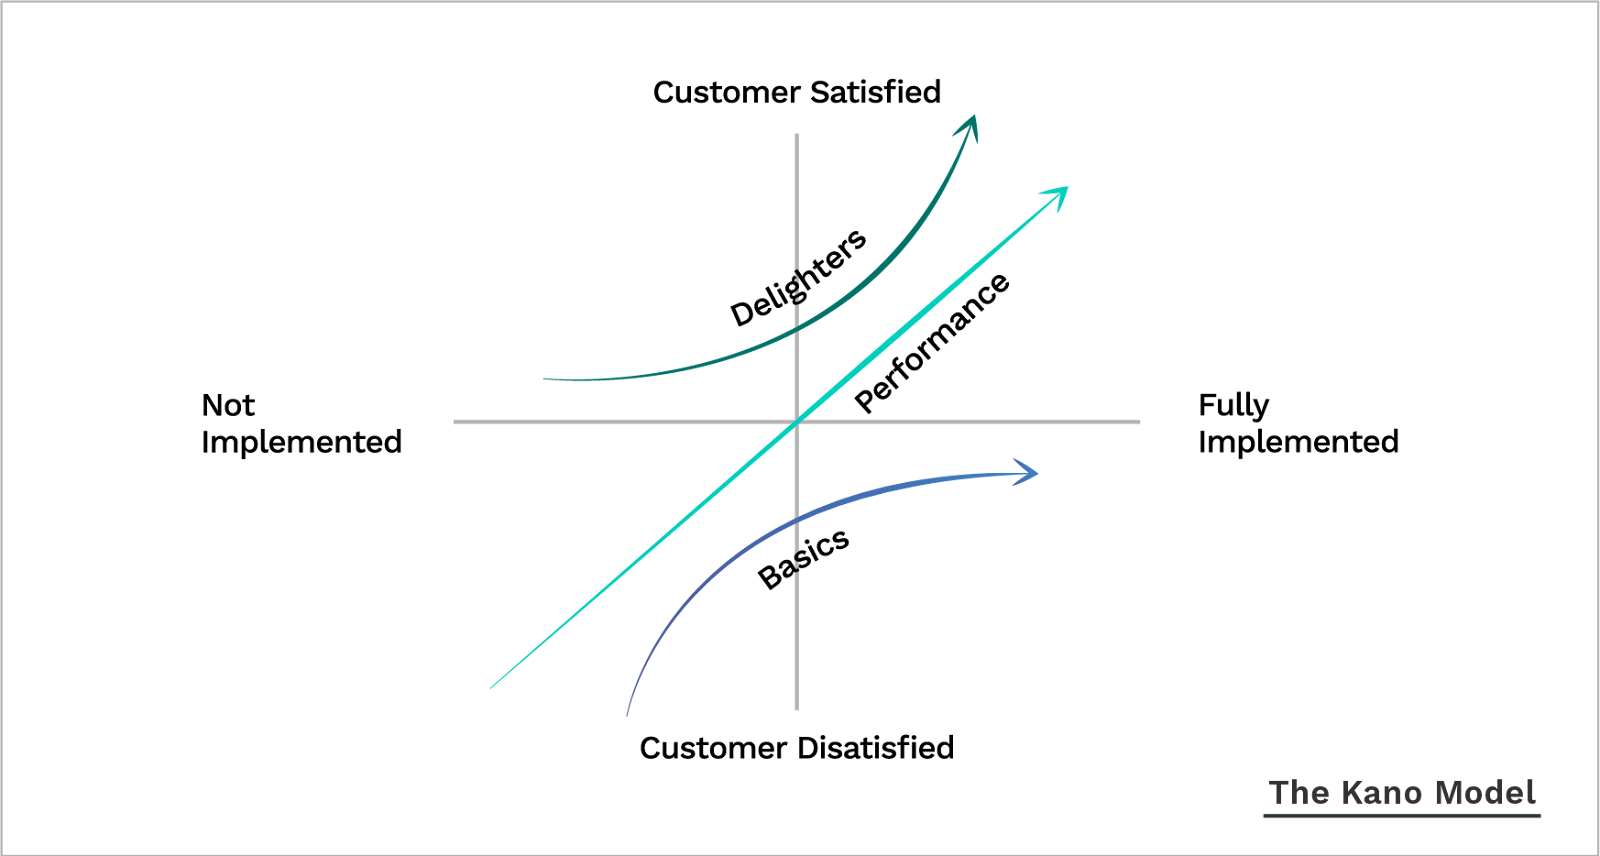
Y-axis consists of customer satisfaction, also known as delight or excitement that goes from total satisfaction to total dissatisfaction
X-axis consists of functionality, also known as achievement, or implementation. It depicts how well the feature has been executed from ‘none’ to ‘done very well’.
According to the Kano model, features are classified into four broad categories based on the customer’s needs:
Expected: Some product features are simply basic or expected. For example, the ability to import your contacts into a CRM system.
Normal: These are also known as performance features. If the number of performance features is more, the number of satisfied customers increases.
Exciting: There are some features that can create a delightful customer experience. These can be chosen from customer feedback.
Indifferent: There are some features whose absence or presence doesn’t affect the customer experience in any way. These are known as indifferent features.
Weighted Scoring Prioritization
Weighted Scoring Prioritization is an important framework that helps you decide what to prioritize in your roadmap. This model is used to assign a percentage of scores to quantify the importance of a feature. It is calculated using a weighted average of each feature’s score across all factors, which acts as prioritization criteria.
The weight given to each driver predicts its relative contribution to the final score. A simple spreadsheet can be used to create a scorecard or a robust product management system to automate the scoring process.
Let’s take a look at ways to use the weighted scoring prioritization framework:
- You need to begin with a clear strategic overview of your next product release.
- Then you will have to compile a list of product features pertaining to that release. Instead of scoring a very single feature, you need to identify the most relevant features for the release.
- You need to define the scoring criteria and allocate weights to each driver. Then curate a list of parameters and decide their importance by giving each of them a specific weight from 0% to 100%. However, ensure that all the stakeholders agree on each criterion.
- Then you will have to go through each feature and allocate a score from 1 to 100 for each driver. The higher the score, the higher the impact that that feature will have on that driver.
The RICE framework
The product management team at Intercom developed an excellent prioritization framework, known as the RICE framework. There are four factors based on which product ideas are evaluated:
- Reach
- Impact
- Confidence
- Effort
Reach
It refers to the number of people that will be affected by a particular feature in a given time. For example, ‘conversions per quarter’ or ‘users per month’.
For example: if 1000 of your user-base open this page every month, and if 10% of people select this feature, then the total reach will be 200 people.
Impact
The impact of a specific feature on an individual personal level is recorded on a scale from 0.5 to 3.
0.5 being low impact and 3 being massive impact.
Confidence
One of the major problems faced by product managers is prioritizing features without customer feedback. This problem can be solved by the ‘confidence’ factor. Through this factor, you can score your features based on your research data.
When you get 100%, it means there is high confidence in your data, while 50% would imply low confidence or lack of data.
Effort
The total time that will be required in a feature, refers to the effort. It is measured as persons per month.
Once all the factors are combined, you can use the formula to calculate the RICE score:
RICE score= (Reach X Impact X Confidence)/Effort
The RICE score can be easily calculated through a spreadsheet that is provided by Intercom. The feature having the highest RICE score should be given priority.
ICE Scoring Model
If you are on the lookout for a speedy prioritization framework, the ICE scoring model is the best option. ICE stands for:
Impact: This depicts how impactful your initiative can be!
Confidence-This factor depicts how confident your initiative can be to bring desired results!
Ease-This factor depicts the easiness of an initiative to build and implement. You can also gauge the costs of the resources associated with the product.
All these factors are scored from 1-10, and the total average of these provides the ICE score. One of the issues associated with this model is that different people could rate the same feature differently based on their perception. Thus, it provides relative prioritization and not data-driven results.
The MoSCow Method
The MoSCow Method was developed by Dai Clegg in 1994. It allows you to figure out what matters most to your stakeholders and customers based on four important buckets.
MoSCow stands for:
Must-Have: This feature has to be present in the product in order to be launched. It is essential and non-negotiable. If you want to identify this feature, then you will have to ask question ‘what would happen if this feature was not there? If the answer is ‘product cannot be launched’, then it has to be included in the Must-Have feature.
Should Have: These features are not important but are essential for the overall success of the product. They are not time-sensitive as compared to Must-have features.
Could Have: These features are not essential but are desirable. They act as bonuses and should only be included if you have time and budget for them.
Won’t Have: These features are least important and are considered “out of scope”. These features will not be considered for the current product but for future product delivery. They bring the smallest return on investment and value for the customer.
Always remember that must-have features are implemented on top priority as compared to other features. ‘Should have’ and ‘Could have’ features are important but they have to be removed in case deadline pressure occurs.
Opportunity Scoring
Also known as opportunity analysis, opportunity scoring is a prioritization framework that focuses on evaluating customer satisfaction based on the results of specific features. If you want to use this model, you will have to ask customers to rank each feature from 1-10 based on two questions:
How important or relevant is this feature or outcome for you?
How contented are you with the existing solution today?
Then, you will have to use those numbers in the following formula:
Importance + (Importance – Satisfaction) = Opportunity
The biggest opportunities will be presented in the features with the highest importance score and lowest satisfaction.
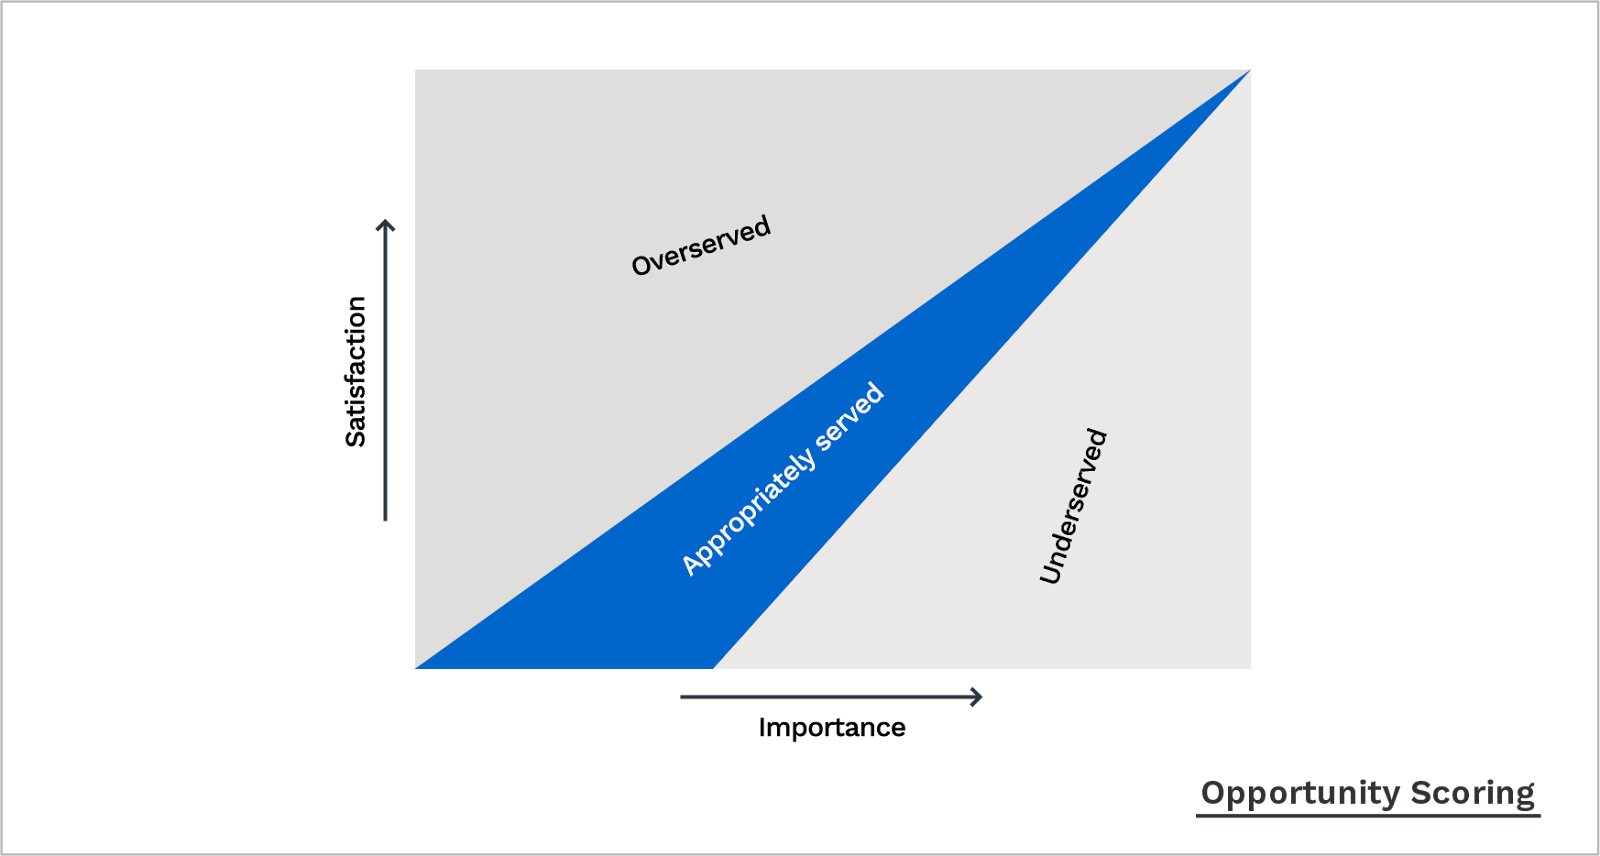
The opportunity scoring model is a simple framework to figure out new ways to innovate your product. This method is easy to visualize and categorize on the graph.
How Deskera Can Assist You?
As a business, you must be diligent with employee leave management. Deskera People allows you to conveniently manage leave, attendance, payroll, and other expenses. Generating payslips for your employees is now easy as the platform also digitizes and automates HR processes.
Key Takeaways
- The process of evaluating the relative importance of work in a disciplined manner is known as prioritization
- Product prioritization frameworks are a set of principles that help you to decide what to work on next
- There are a plethora of prioritization frameworks that you can use to prioritize your work
- Value vs Complexity framework provides product teams an objective way to determine which initiatives to prioritize in order to succeed. This acts as a prioritization instrument and is simply a 2X2 grid matrix with ‘value’ plotted against ‘complexity’
- The Kano model is a set of guidelines and techniques that focuses on categorizing and prioritizing customer needs, enhancing product development, and improving customer satisfaction.
- Weighted Scoring Prioritization is an important framework that helps you decide what to prioritize in your roadmap. This model is used to assign a percentage of scores to quantify the importance of a feature
- The RICE framework is based on four factors including Reach, Impact, Confidence, and Effort
- RICE score= (Reach X Impact X Confidence)/Effort
- ICE Scoring Model is based on three factors including Impact, Confidence, and Ease. All these factors are scored from 1-10, and the total average of these provides the ICE score
- In the MoSCow prioritization framework, MoSCow stands for Must-Have, Should-Have, Could-Have, and Won’t Have. must-have features are implemented on top priority as compared to other features. ‘Should have’ and ‘Could have’ features are important but they have to be removed in case deadline pressure occurs.
- Opportunity scoring is a prioritization framework that focuses on evaluating customer satisfaction based on the results of specific features
Related Articles