

A start-up is more often than not a seed of one’s ambitions, dreams, hard work and perseverance. It is as daunting as it is exciting with all of its opportunities, challenges, strengths and weaknesses wrapped into one whole package.
Start-ups are vulnerable to destruction if not looked after well enough. That is where KPIs come into the scene.

KPI are also known as the Key Performance Indicators. KPIs are the indicators that give insights into the functioning of the start-up.KPIs bring to light the business health.
If monitored, these can save the start-ups from failing, maintain their growth and reach their full potential. It gives the investors an analytical view of your start-up, its performance and its future.
What are Key Performance Indicators?
Key Performance Indicators also commonly known as KPI's are those measurable values that show how effectively a company is achieving its objectives. To fully assess the business performance, the key performance indicators are used at several levels.
The low level indicators focus on specific departments like marketing, sales, purchase, HR. The high level indicators focus on the overall performance of the business. Based on this, it is also decided which business processes need the key performance indicators.
In the case of start-ups, there are 8 important start-up KPIs. These KPI's are as mentioned below:
- Customer Acquisition Cost
- Average Sales Cycle Length
- Active Users
- Cash Runaway
- Customer Churn Rate
- First Response Time
- Gross Profit Margin
- Revenue Growth Rate
In this article, let us look into some of the KPIs that you can use for your business or start-up.
Top Key Performance Metrics Used For StartUps
Let us go more into details of the KPIs that you can consider for the growth of your business below:
Customer Acquisition Cost (CAC)
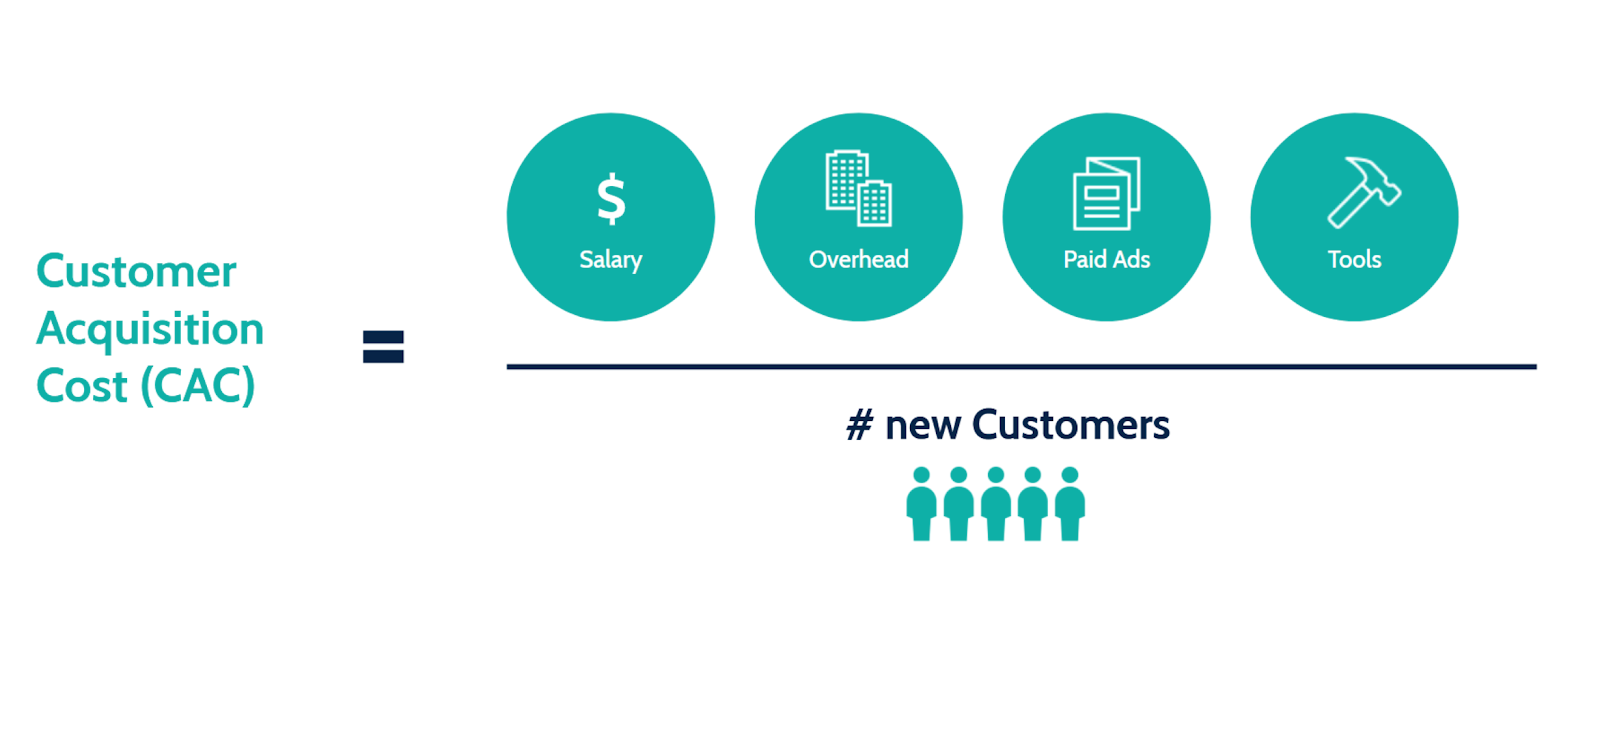
Customer Acquisition Cost is the amount spent on marketing, salaries and sales expenses to gain one new customer. CAC is a month on month measure used to see how much money is being spent on acquiring a single customer. The lower the CAC, lower is the amount spend, and better is your gross profit.
While customers are vital for any business to run and succeed, it is important to keep track of its acquisition costs or CAC. This start-up KPI helps in finding out whether the customer acquisition costs are too high or does it have a space for investing in.
When a detailed Customer Acquisition Cost is studied, it gives the specific marketing and sales activities that have the lowest cost. This method becomes the most profitable choice for the concerned business.
Customer Acquisition Cost as a KPI is a vital and basic indicator for determining the long-run growth of the business.
Formula of Customer Acquisition Cost
Customer Acquisition Cost = Total Sales and Marketing Expenses/New Customer Acquired
For example, in a 4 month period, the total marketing expenditure is $450 and total sales expenditure is $650. In that time period, the number of new customers gained is 40.
Hence, Customer Acquisition Cost (CAC) = ($650 +$450)/40 = $27.5
Average Sales Cycle Length
Average Sales Cycle Length measures the total time taken from initiating a sale contact up till closing the deal. Average sales cycle length is a part of the business' sales funnel which shows the buyer's entire journey from the marketing context.
To measure average sales cycle length, each industry has a benchmark length which the business can compare against. Average sales cycle length is also a measure of the efficiency of the sales pipeline in CRM.
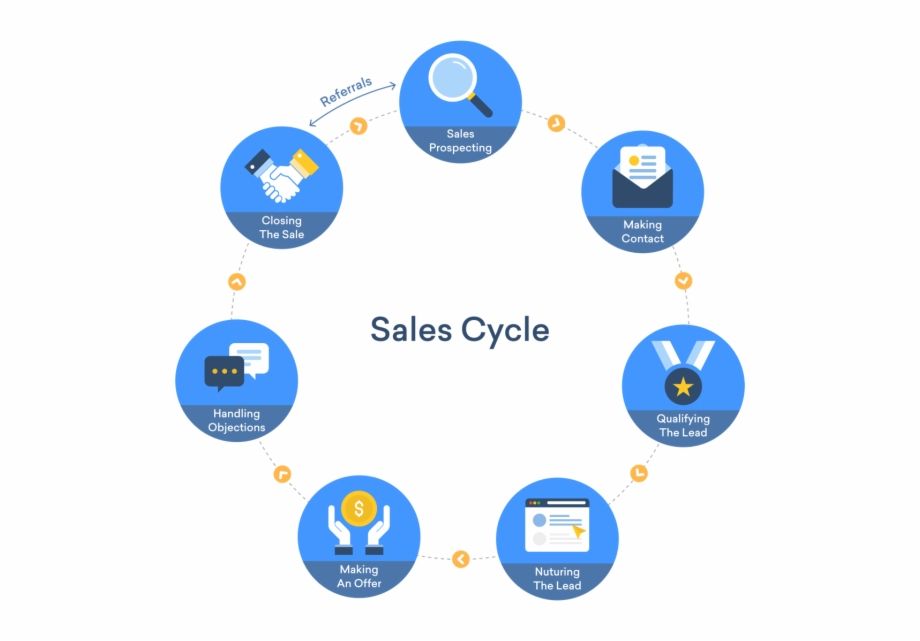
It is expected that the sales cycle length should be steady for the business. This length should reduce with the expansion of the business. If an increase in this length is observed, it indicates a problem with the sales process of the business. When this problem is rectified, it helps the business to grow and hence generate more revenue.
Sales cycle KPI is thus one of the core indicators of the profitability and efficiency of the business in carrying out its sales.
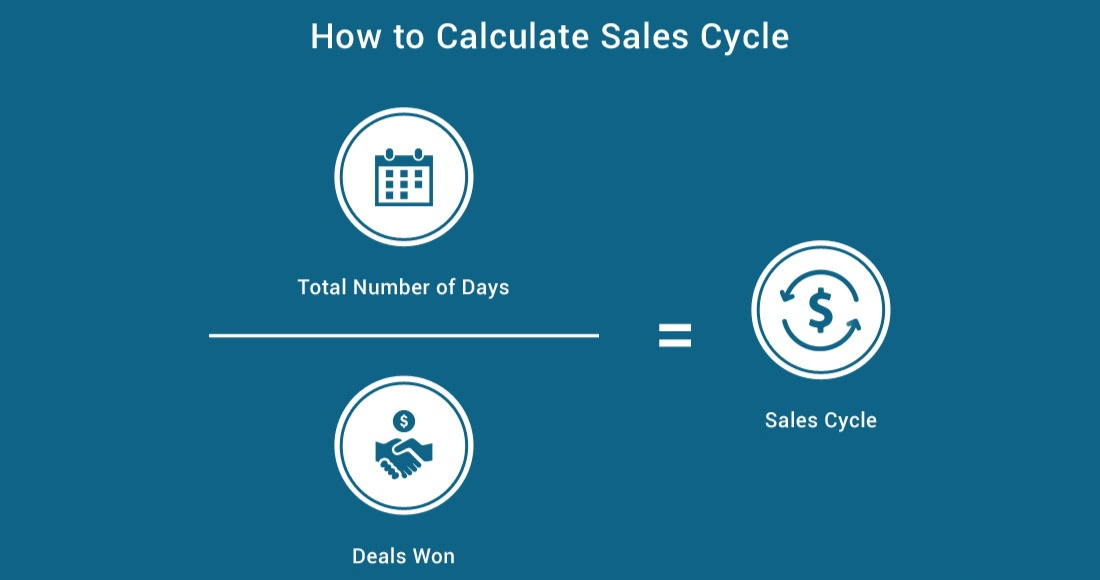
Formula for Average Sales Cycle Length
The first step for calculating this is to calculate the time spent on each sale. This then gives the total time spent on all sales.
Average Sales Cycle Length = Total Time between First Contact and Sale for all Sales/ No. of Sales
For Example, a firm named Glassware closed 5 deals recently. Each of their sales cycle length was as follows:
Deal A took 15 days , Deal B took 20 days, Deal C took 18 days, Deal D took 12 days, Deal E took 16 days
To find the Average Sales Cycle, we add all these individual sales cycle length to get the total of 81 days for all sales combined.
Hence, Average Sales Cycle Length = 81/5 = 16.2 days
Active Users
Active Users are when in the given time frame (decided by the business) they have interacted with the business’ product, application or website. The success of a business is determined on the basis of its active users.
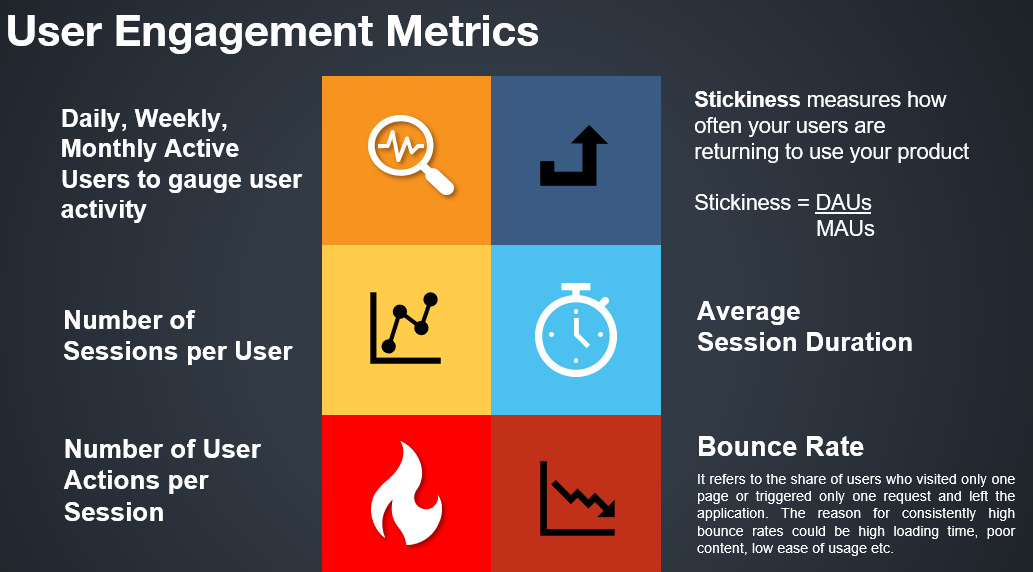
The more active users that a business will have, more will be its growth and therefore its revenue. A marketing done correctly, becomes the first step of securing customer loyalty. The tracking of active users is done in 2 main categories- DAU- which is the Daily Active Users and MAU- which is the Monthly Active Users.
Measurement of active users indicates the product stickiness of the business. It also shows whether the customers are engaging with it or not. The active user KPI gauges whether the product has been a success or not.
The first step in calculating active users is to define what an active user is for that product. Based on it, DAU is the sum of unique active users in a single day and MAU is the sum of the unique active users in a month.
For Example, there is a mobile gaming app known as ‘invisibility’ and it has defined active users as those who have created an account, play a game and play a game with friends. In this case,
On 15th June 2020, there were 40 account creations, out of which 30 have played a game and 25 have played a game individually as well as with friends. In this case, DAU for 15th June 2020 will be 25 users.
However, for the month of June 2020, there were 250 account creations, 175 of which played games individually and 150 of which played games with friends too, MAU for June 2020 will be 150 users.
Now,
Product Stickiness = Daily Active Users (DAU)/Monthly Active Users (MAU)
Hence, 25/150 = 0.1667 x 100 = 16.67% is the product stickiness.
Cash Runaway
Cash Runaway tells the business how long its funds are going to last. Cash Runaway also tells whether and how it needs to work on its fundraising efforts. It is hence a vital KPI that also involves cash accounting of the business and start-ups.

Cash runaway helps the business in determining whether it needs to focus more on its sales, decreasing the expenses or finding other sources to meet the cash requirements of the business.
Due to this, cash runaway is calculated with respect to months and how long will the current balance last.
It is also subject to change with changes in the cash balances, burn rate (i.e., how quickly is the business expending its money) and revenues that are yet to be received. Revenue recognition becomes must to get an accurate measurement of the cash runaway. The business' balance sheet is needed to calculate the Cash Runaway.
Cash runaway can become even more insightful when the business can calculate it based on the expected spending and revenue.
Formula for Cash Runaway
Cash Runaway = Cash Balance/ Monthly Burn Rate
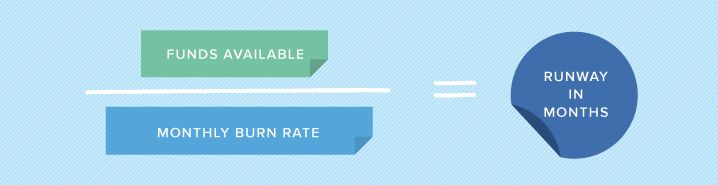
For Example, the starting balance of a company ABC is $100000 and the ending balance after 3 months is $90000.
Burn Rate = (Starting Balance - Ending Balance)/ No. of Months
Hence, Burn Rate = ($100000-$90000)/3 = $3333.33/month
Hence, Cash runaway = $90000/$3333.33 = 27 months before the business runs out of the cash.
Customer Churn Rate
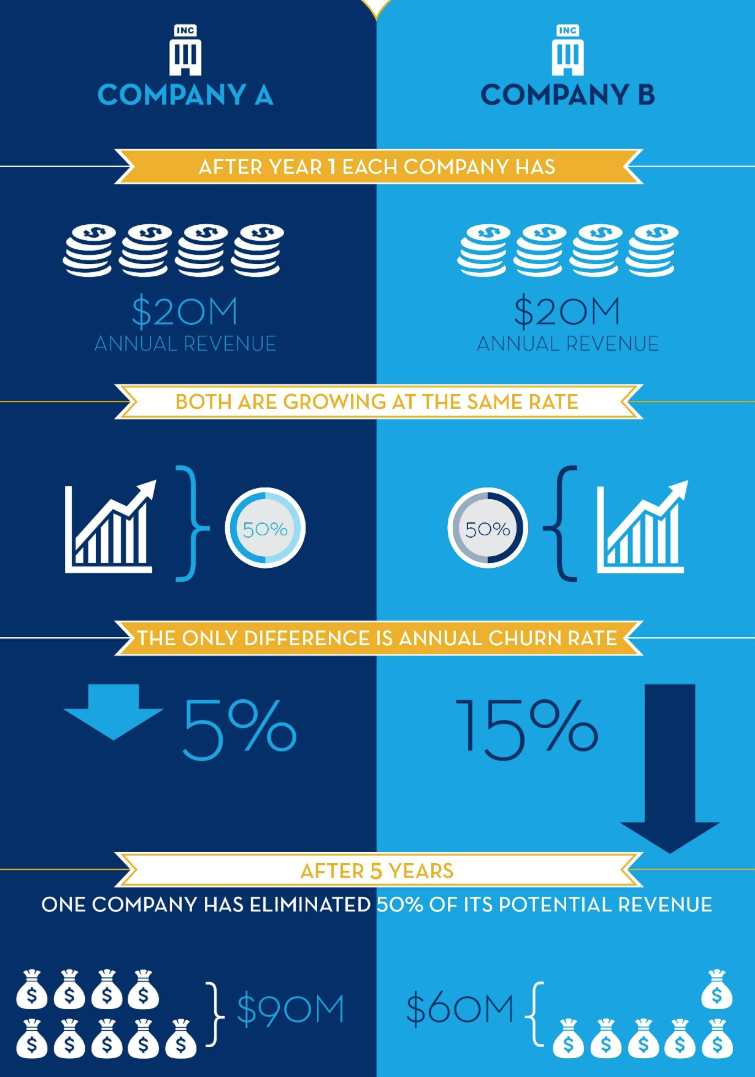
Customer Churn Rate is a KPI that shows the percentage of customers that the business lost during a time.
Customer Churn Rate is hence indicative of whether the customers are happy and satisfied with the product concerned. It also demonstrates whether the customers believe it to be solving a problem or not.
If a low churn rate is found, it evidences the general satisfaction of the business.
What needs to be kept in mind is that the customer churn rate is calculated only for those customers who are paying and not for those who are availing free trials and services. This indicator is also indicative of poor customer fit, product issues and wrong pricing models.
The churn rate KPI is found to be especially important for any business as the cost of re-acquiring a churned-out customer by providing value-added services is lesser than the one required for acquiring new customers.
Customer retention rate is premised on the same concept, with the focus now being on the customers retained. In fact, as a start-up KPI, customer churn rate helps to identify how to improve customer retention. This will lead to increasing revenues for the business.
Formula for Customer Churn Rate
Customer Churn Rate (%) = (Total Customers churned in this time period/ Total customers at the start of this time period) x 100
For Example, on 1st May 2021, Wetube, a video streaming company had 2300 customers. By 31st May 2021, it had lost 150 of its customers.
Hence, Customer Churn Rate= (150/2300) x 100 = 6.52%
Customer Lifetime Value
Customer lifetime value or (CLV) is one of the key KPIs likely to be tracked as part of a customer experience. CLV is a measurement of how valuable a customer is to your business with an unlimited time span instead of just the first purchase. It is an important metric as it costs less to keep existing customers than acquiring new ones. Hence, increasing the value of your existing customers is a great way to drive growth.
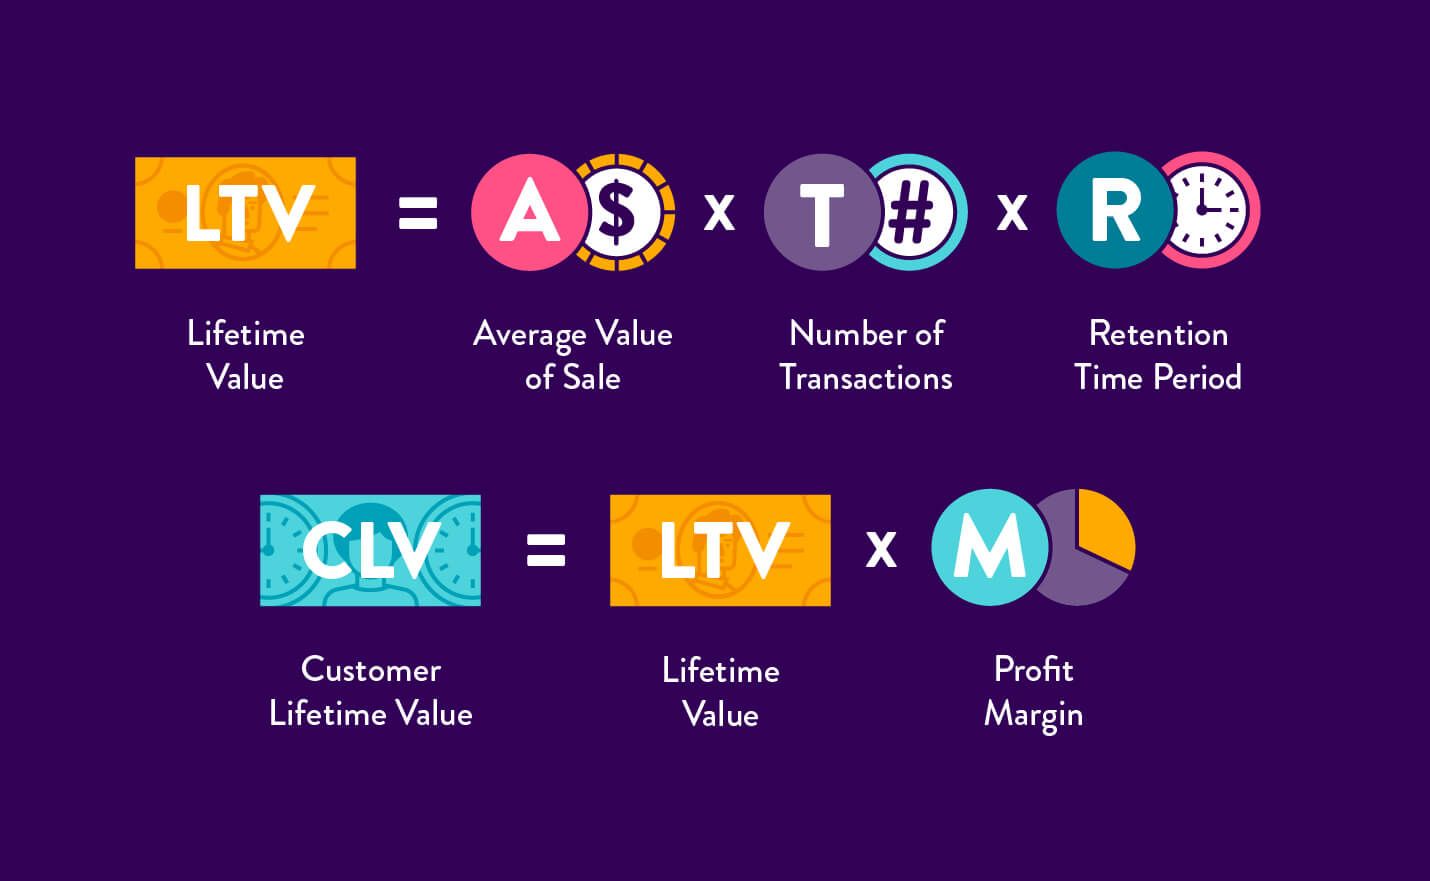
For example, lets say that the average sales in a fashion store are $90 and, on average, a customer shops five times every two years. The lifetime value is calculated as LTV = $90 x 5 x 2 = $900.
Furthermore, the profit margin in the clothing store is 10%, hence the CLV is as follows: CLV = $90 x 5 x 2 x 20% = $450.
The lifetime value number can help a business estimate future cash flows and the number of customers they need to obtain to achieve profitability.
First Response Time
First Response Time is a KPI that measures the time taken by the business’ customer support staff to respond to the customer after his query.
Customers prefer choosing those businesses which have a fast response time. This makes them not only happy and trusting of the business, but also well-looked after. If a business response time is found to be slow by the customers, they are more likely to get frustrated and go to other business alternatives.

Working on the inputs received from this KPI would ensure that the customers stay interested in the business and its products.
First Response Time also helps the business in determining whether it should or should not outsource its customer services. Customers are vital for a business to succeed and First Response Time as a KPI makes the business focus on customer experience.
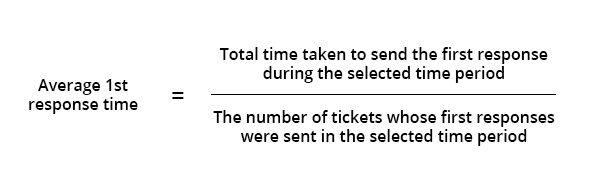
Formula for Average First Response Time
Average First Response Time = Total initial response time for all tickets/ No. of tickets
For Example, a company received 1200 tickets in April 2020. To give the first response to every ticket, the support team took 9000 minutes in total.
Hence, Average First Response Time = 9000/1200 = 7.5 minutes
Gross Profit Margin
Gross Profit Margin is a KPI that measures the business profits from its activities. Without making profits, a business cannot succeed. Profit earned by the business ensures that it can develop its infrastructure and give more returns to the investors.
Gross Profit Margin is a measure of the difference between revenue and the cost of the goods sold.
When undertaken for individual products, it helps the business in identifying high profiting items that it could focus on even more. When compared against revenue, it also shows whether or not the cost of the goods is too high.
Gross Profit Margin is also a measure of the consistency of the sales of the business. The sign of a steady and successful business is a steady Gross Profit Margin over some time.
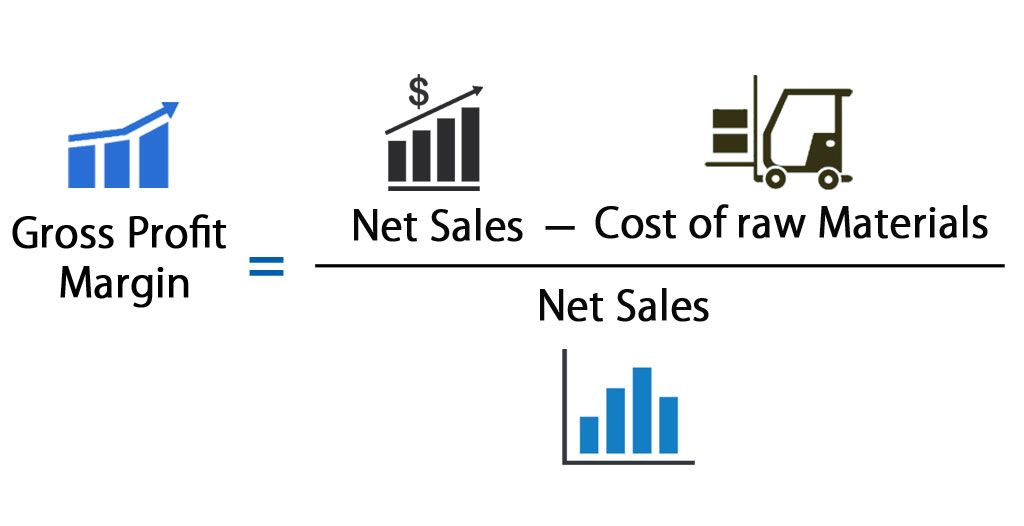
Formula for Gross Profit Margin (%)
Gross Profit Margin (%) = [(Total Revenue – Cost of Goods Sold)/ Total Revenue] x 100
For Example, Company Xphones has a revenue of $150 million in the financial year 2017-2018. The Cost of Goods Sold was found to be $80 million.
Hence, Gross Profit Margin (%) = [($150 million - $80 million)/ $150 million] x 100 = 46.67%
Revenue Growth Rate
Revenue Growth Rate is a measurement of the monthly percentage increase in revenue. Revenue is an earning for the business in return for its products and services. An increasing revenue growth rate is indicative of a healthy business with a scope for further expansion of its activities.
Revenue Growth Rate is a KPI which shows the pace at which the business is growing.
High revenue growth also helps in measuring the increasing demand for a product. This helps in securing its growth rate and therefore gross profit margin even for the future.
Formula for Revenue Growth Rate
Revenue Growth Rate (%) = [(Revenue this month - Revenue Last Month)/ Revenue Last Month] x 100
For Example, a company called “Antics Boutique” recorded a revenue of $4000 in this month and a revenue of $1500 in the previous month.
Hence, Revenue Growth Rate (%) = [($4000- $1500)/ $1500] x 100 = 166.67%
How can Deskera help your Business Manage and Measure KPIs?
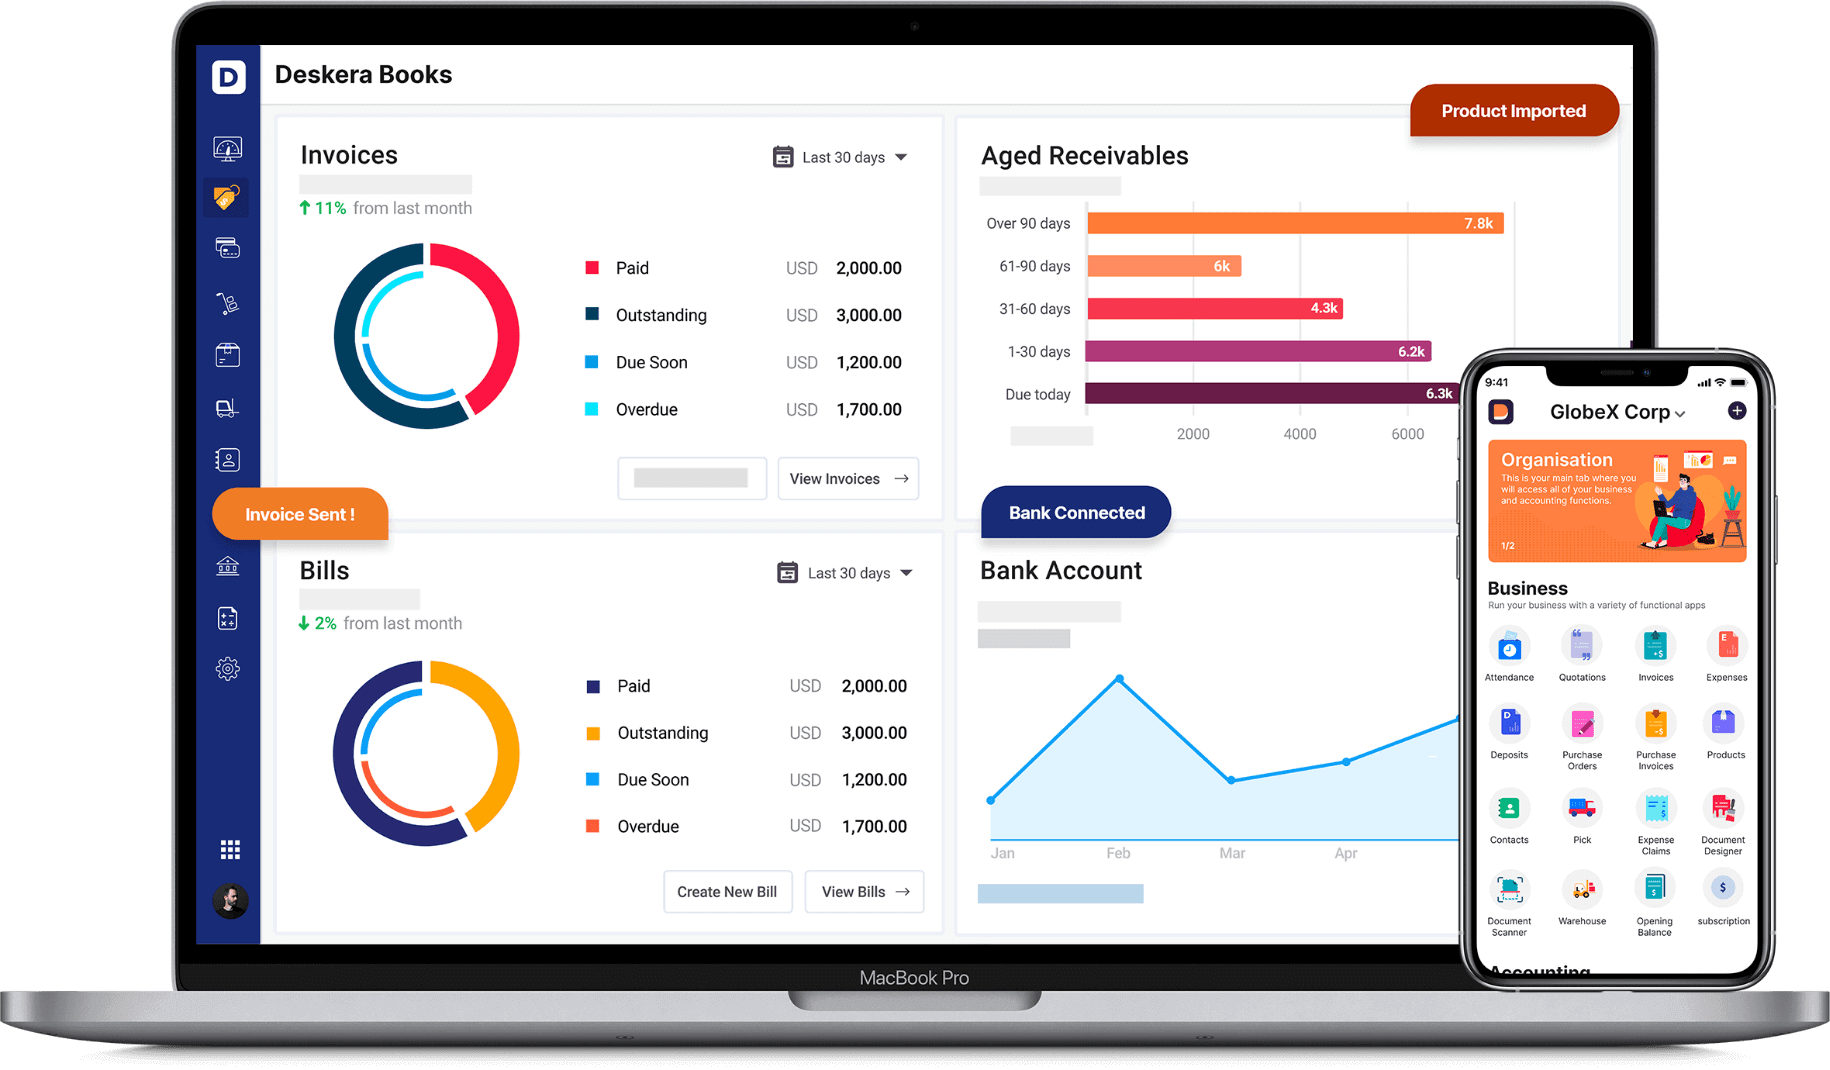
In order for a business to grow steadily and stay updated with its strengths and weaknesses, it needs to continuously monitor these start-up KPIs. It is Deskera Books which will assist your business in monitoring this.
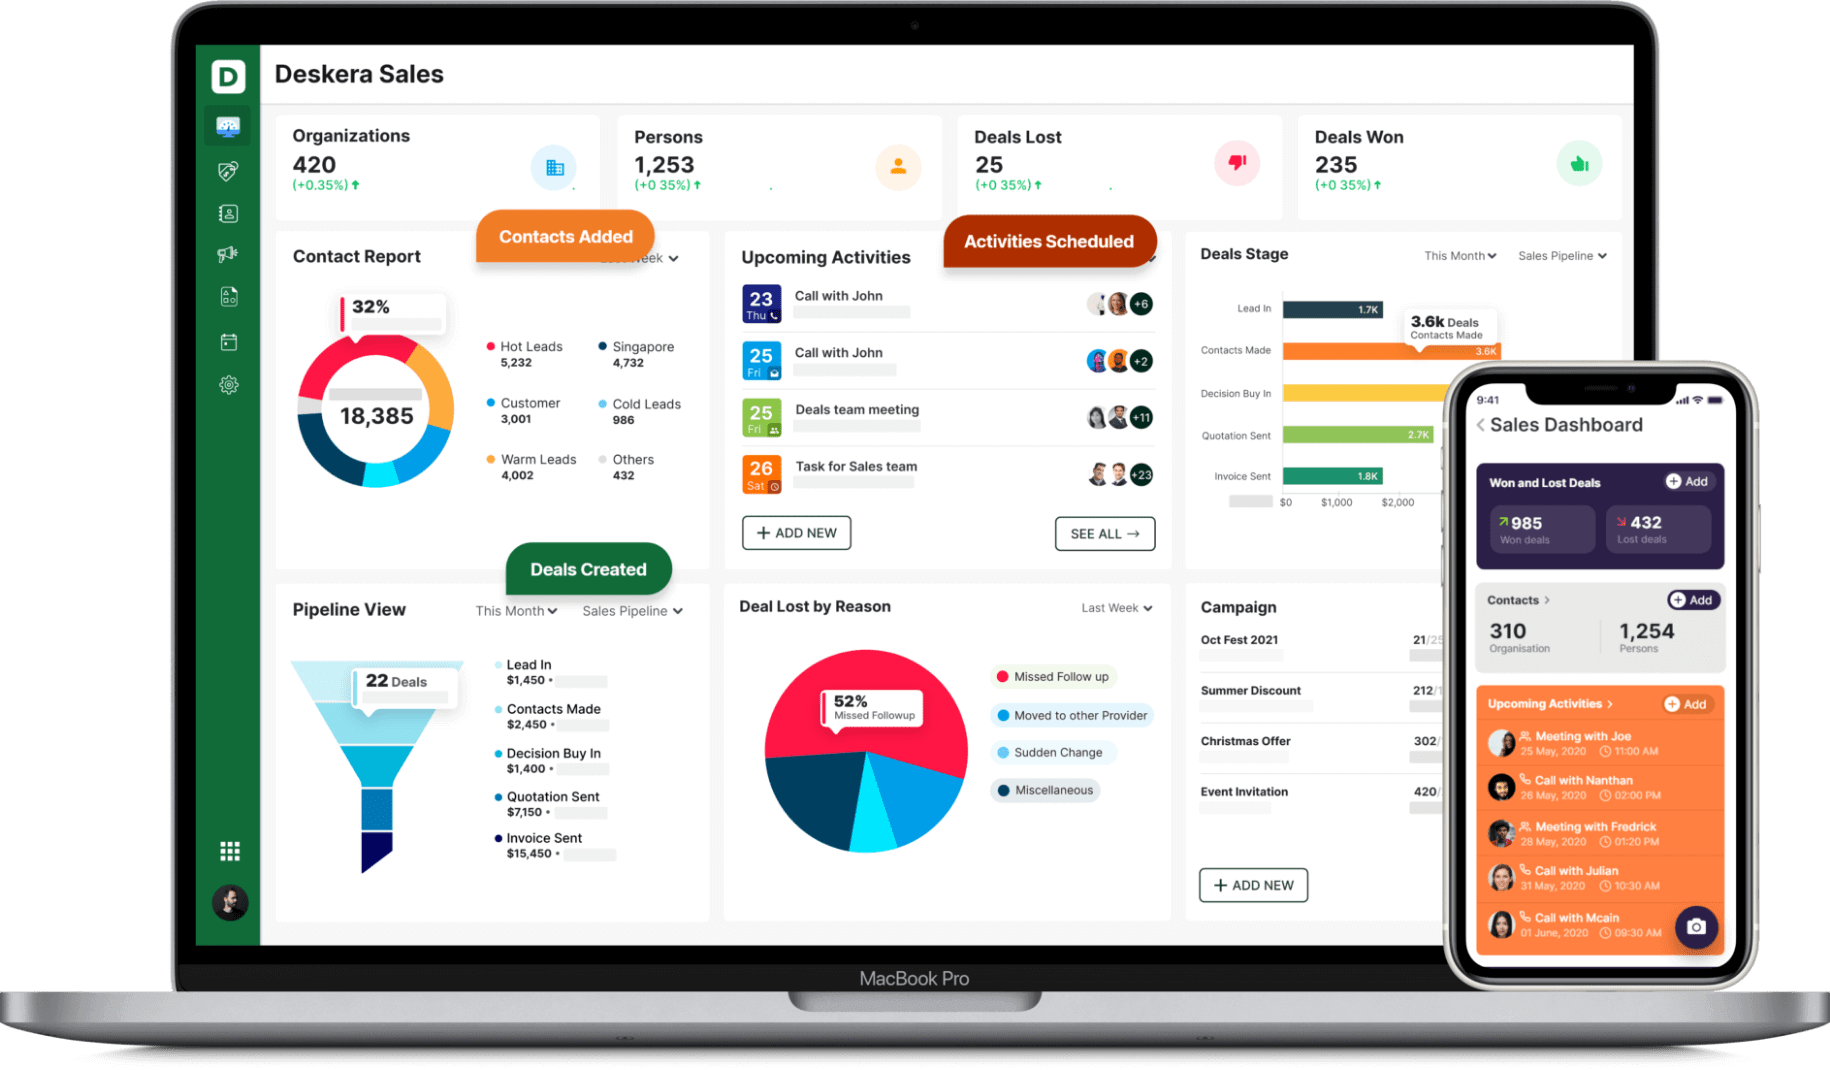
Further on, Deskera CRM would give detailed analysis into start-up KPIs like Average Sales Cycle Length and Customer Acquisition Costs.
Deskera is hence that cloud platform which aims to assist start-ups in the best possible manner. It is a user-friendly, one stop platform for all the needs of a start-up.
Key Takeaways
All of these KPIs are important throughout the start-up’s lifecycle. However, depending on the growth phase that they are a part of, the priority of these indicators gets changed. The vital start-up KPIs are:
- Customer Acquisition Cost
- Average Sales Cycle Length
- Active Users
- Cash Runaway
- Customer Churn
- Customer Lifetime Value
- First Response Time
- Gross Profit Margin
- Revenue Growth Rate
For instance, when the business is in the phase of steady growth, it can prioritize customer churn rate and active users as its prime indicators. This gives them the insights for further increasing their growth rate.
All these indicators need to be set and used as per the business’ specifics. This will not only find areas of improvement but also show the areas of strong performance. This ensures further growth of the business.
KPIs are those tools of analysis that are irreplaceable for any business.