
What if you could measure exactly how much of your production ends up as waste—and then cut it down to save thousands of dollars each month? That’s exactly what understanding your scrap rate allows you to do. Scrap rate is one of the most telling metrics in manufacturing, giving you a clear picture of inefficiencies in your process and helping you drive continuous improvement.
In any manufacturing environment, some material loss is inevitable. But without tracking your scrap rate, you’re essentially operating blind—guessing at the cost of waste instead of controlling it. By calculating and monitoring scrap rate, businesses can identify patterns, prevent defects, and improve both product quality and profitability. In competitive markets, a high scrap rate doesn’t just mean wasted materials; it could mean lost customers.
Scrap rate isn’t just a KPI for large factories—it’s equally important for small and mid-sized manufacturers who need to stay lean and cost-efficient. From quality control teams to production floor supervisors, everyone benefits from knowing exactly how much scrap is generated and why. The key lies in accurate tracking, smart analysis, and using the right tools to act on that data.
This is where modern manufacturing solutions like Deskera Manufacturing ERP come in. Deskera helps you monitor real-time scrap data, track material usage, and generate insightful reports automatically. With features like integrated production planning, quality checks, and inventory management, Deskera ERP empowers you to minimize waste, improve yields, and run a more sustainable operation—all in one platform.
What Is Scrap Rate?
Scrap rate is a key performance indicator (KPI) in manufacturing that measures the percentage of materials or products that must be discarded because they do not meet quality standards. These can include raw materials, semi-finished components, or even final products that are deemed unusable due to defects, damage, or non-compliance with specifications. In simple terms, scrap rate helps quantify how much waste is generated during the production process.
Different manufacturers define "scrap" in slightly different ways. Some include only defective final products, while others expand the definition to encompass spoiled raw materials or waste created during production stages. It’s important for businesses to agree on a consistent definition of scrap within their operations to ensure accurate tracking and meaningful analysis.
A high scrap rate typically indicates inefficiencies—such as poor material quality, flawed processes, or inadequate quality control—while a low scrap rate reflects lean operations and high production efficiency. Tracking this metric over time allows businesses to detect performance gaps, control material costs, and implement improvements in their manufacturing systems. For instance, a rising scrap rate might highlight equipment malfunction, a need for workforce training, or ineffective sourcing of materials.
Scrap rate is usually expressed as a percentage and calculated by dividing the quantity of scrapped units by the total units produced within a given time frame. It also plays an important role in assessing the yield—how many acceptable products are produced relative to total production. As industries push toward greater sustainability and operational efficiency, monitoring and reducing scrap rate becomes vital not just for cost control but also for reducing environmental impact.
Types of Scrap in Manufacturing
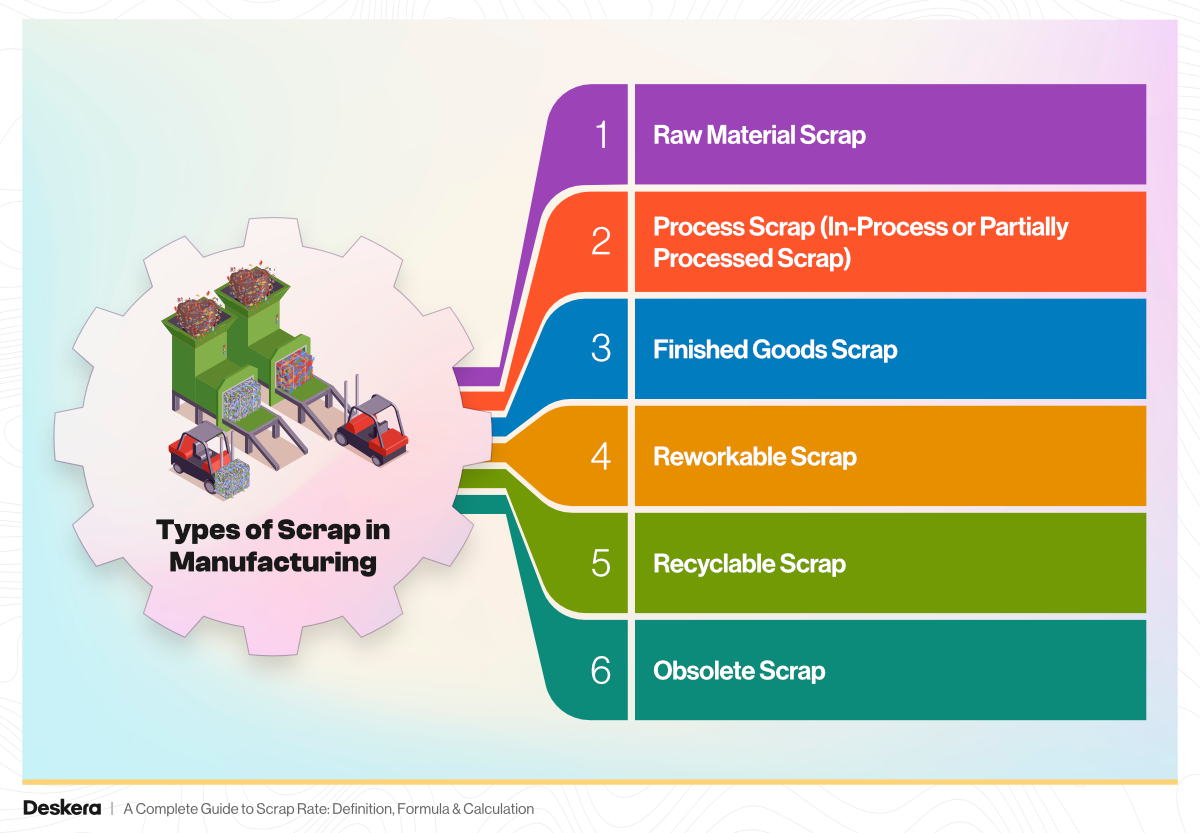
Understanding the types of scrap can help manufacturers pinpoint where waste is occurring and what corrective actions are needed. Scrap can generally be classified into the following categories:
1. Raw Material Scrap
- Description: Waste generated from unused or unusable raw materials before they enter the production line.
- Examples: Damaged raw materials, spoiled batches, or materials that fail pre-production quality checks.
- Cause: Poor storage, supplier quality issues, or incorrect material specifications.
2. Process Scrap (In-Process or Partially Processed Scrap)
- Description: Items that are scrapped after partial processing but before completion.
- Examples: Components that fail at an intermediate production stage due to machining errors or incorrect assembly.
- Cause: Equipment malfunction, operator error, or process misalignment.
3. Finished Goods Scrap
- Description: Final products that do not meet quality standards and cannot be sold or used.
- Examples: Off-spec items, defective packaging, or mislabeling that renders the product unusable.
- Cause: Quality control issues, faulty design, or last-stage process errors.
4. Reworkable Scrap
- Description: Items that are initially rejected but can be reprocessed or repaired to meet quality standards.
- Examples: Products with cosmetic defects, or parts requiring re-machining.
- Cause: Minor quality issues that can be corrected with additional effort.
5. Recyclable Scrap
- Description: Material waste that can be recovered and reused, either in-house or externally.
- Examples: Metal shavings, plastic trimmings, cardboard waste.
- Cause: Trimming, cutting, or standard production processes.
6. Obsolete Scrap
- Description: Inventory or materials that become unusable due to design changes, expired shelf life, or discontinued products.
- Examples: Outdated components, expired chemicals, obsolete parts.
- Cause: Poor inventory management or lack of change planning.
Why Scrap Rate Is a Critical Metric in Manufacturing
Scrap rate goes beyond tracking material waste—it's a powerful indicator of how well your manufacturing processes are performing. From operational efficiency to strategic planning, this metric offers visibility into cost drivers, quality control gaps, and process stability.
Monitoring scrap rate regularly allows businesses to make informed decisions that reduce waste, improve product quality, and increase profitability. Here's how:
- Benchmark production efficiency: Scrap rate helps you set clear, data-driven benchmarks for acceptable waste levels based on your production capacity and speed. If the scrap rate exceeds these thresholds, it may signal that increased production speed is pushing your processes beyond their optimal limits—leading to equipment stress, procedural errors, or higher defect rates. These insights allow you to adjust workflows, slow down specific operations, or reassess production goals.
- Identify and improve quality control weak spots: By tracking where most of the scrap is generated along the production line, you can pinpoint the exact steps where defects occur. This enables manufacturers to implement targeted quality checks, train staff on process improvements, and modify procedures to catch issues early—ultimately preventing defective products from progressing through the system and saving rework costs.
- Support data-backed equipment decisions: Persistent or increasing scrap related to specific machines can indicate wear and tear, misalignment, or outdated technology. Monitoring scrap data allows operations managers to prioritize equipment repairs or upgrades based on real-time performance metrics. This prevents unplanned downtime and supports a proactive maintenance approach that reduces long-term costs.
- Optimize inventory and material planning: Scrap rate data helps procurement and production teams calculate more accurate inventory reorder points. By understanding average material loss during production, companies can reduce overordering, minimize material shortages, and lower carrying costs. This leads to better forecasting, leaner operations, and reduced waste in both materials and warehouse space.
- Enhance supplier evaluation and sourcing strategies: If excessive scrap is traced back to subpar raw materials, the data can be used to negotiate better terms with vendors, establish stricter quality requirements, or switch to more reliable suppliers. Additionally, scrap trends can guide decisions about outsourcing processes that require specialized equipment or skill sets—especially if in-house capabilities are contributing to higher defect rates.
- Drive strategic decision-making at all levels: For executive leaders, scrap rate is a valuable metric for long-term planning. Trends in scrap generation can justify investments in automation, employee training, lean manufacturing initiatives, or redesigning products to minimize waste. It also supports sustainability goals by identifying opportunities to reduce environmental impact through better resource utilization.
In essence, scrap rate is not just a factory-floor concern. It connects operational, financial, and strategic priorities—making it a crucial metric for building a smarter, more resilient, and competitive manufacturing business.
Scrap Rate Formula
Calculating your scrap rate is essential to measure production efficiency and minimize material waste. The formula is simple but powerful—it tells you what percentage of your total production is lost to unusable or defective materials.
Basic Scrap Rate Formula:
Scrap Rate (%) = (Scrap Quantity / Total Production Quantity) x 100
Where:
- Scrap Quantity is the number of units (or amount of material) that were discarded because they did not meet quality standards.
- Total Production Quantity is the total number of units (or material amount) produced, including both good and defective units.
Example Calculation:
Let’s say your factory produced 10,000 units in one month, but 450 units were defective and had to be scrapped.
Scrap Rate: (450/10000) x 100 = 4.5%
This means 4.5% of your production resulted in waste.
Pro Tip: You can also calculate scrap rate by weight (e.g., kilograms or tons) instead of by unit count if your production involves variable-sized items or raw material inputs like metal or plastic.
Tracking your scrap rate consistently helps you uncover trends, reduce costs, and drive continuous process improvement.
How to Calculate Scrap Rate: Step-by-Step
Calculating your scrap rate using a methodical approach ensures consistency across production cycles, departments, and facilities. This consistency is crucial for tracking long-term trends, benchmarking performance, and identifying inefficiencies that might otherwise go unnoticed. Follow these four essential steps to accurately calculate scrap rate:
Step 1: Total the Number of Scrapped Items
Start by collecting all instances of scrap—materials or products that failed to meet quality standards and were discarded during production. Be sure to include scrap from every stage, including:
- Incoming material inspections
- Manufacturing operations (e.g., machining, cutting, molding)
- Final quality control or packaging stages
Depending on your production model, you can measure scrap by:
- Units (number of defective parts or products)
- Mass (kilograms, pounds, etc.)—useful for bulk materials like textiles or metals
- Value (monetary worth of wasted material)—ideal when costs vary across components
Step 2: Tabulate the Total Number of Units Produced
Next, calculate the total quantity of material or items processed during the time period. This includes both the successfully finished products and the scrapped ones.
Here’s how to get an accurate picture:
- Review production logs and batch records
- Cross-check inventory reports to verify material usage
- Factor in all received and consumed materials, using the formula:
Total Material Used = (Starting Inventory + Materials Received)−Ending Inventory
Like scrap, total production can be measured in units, weight, or value—just stay consistent with the measurement type used in Step 1.
Step 3: Insert the Values Into the Scrap Rate Formula
Now, plug the numbers into the basic scrap rate formula:
Scrap Rate = Scrapped Quantity / Total Production Quantity
Example: If your factory scrapped 80 units out of 2,000 total units:
Scrap Rate = 80 / 2,000 = 0.04
Step 4: Multiply by 100 to Express as a Percentage
Convert the decimal to a percentage for a clear and actionable metric:
0.04 × 100 = 4%
This means 4% of your total production during that period resulted in unusable or discarded material.
Example: Scrap Rate by Mass
Let’s say a denim manufacturer, Twin Pants, processes 10,000 kg of denim in a quarter and records:
- 120 kg of defective fabric (quality inspection)
- 250 kg wasted during pattern cutting
- 80 kg damaged during handling
The total scrap is:
120+250+80 = 450 kg
Now apply the formula:
Scrap Rate = (450 / 10,000) ×100=4.5%
By comparing this figure to past quarters (e.g., 3% and 4%), the company realized an increasing trend. They took corrective action by optimizing cutting layouts and upgrading machinery to reduce future fabric waste.
A Note on Benchmarks
There’s no universal “ideal” scrap rate—it depends on your industry, production complexity, and materials. However, lower is better, as it indicates greater efficiency, reduced waste, and better use of resources. Tracking scrap rate over time helps you diagnose problems, set realistic goals, and implement sustainable improvements.
Factors That Influence Scrap Rate

Scrap rate doesn’t happen in isolation—it's shaped by a combination of internal processes, external conditions, and resource quality. Understanding what contributes to a high or low scrap rate helps manufacturers target root causes and drive meaningful improvements.
Below are the most common factors that influence scrap rate in a manufacturing setting:
1. Raw Material Quality
Low-grade or inconsistent materials can lead to immediate rejection during inspection or failure during production. Variations in texture, strength, or dimension may result in increased waste and rework. Even when sourced from certified vendors, material defects can slip through and impact scrap levels significantly.
2. Machine Condition and Maintenance
Equipment that is outdated, improperly calibrated, or poorly maintained can produce inconsistent or defective parts. Dull tools, misaligned cutters, or irregular pressure can cause material damage during processing. Regular preventive maintenance and timely upgrades are essential to keeping scrap levels low.
3. Operator Skill and Training
Human error is a major contributor to scrap—especially in processes that require manual oversight or adjustment. Lack of operator training, unclear work instructions, or inconsistent handling techniques can lead to faulty outputs. Investing in workforce development pays off through reduced material waste and better process adherence.
4. Process Design and Standardization
Processes that are overly complex or not well-documented can increase variability in outcomes. If steps are not standardized across shifts or operators, the likelihood of errors and defects rises. Clear SOPs (Standard Operating Procedures) and lean practices help create predictable, low-waste production cycles.
5. Product Design Complexity
Highly intricate product designs, tight tolerances, or multiple assembly stages can introduce more opportunities for error. Poorly optimized designs may also generate excess material waste during cutting or machining. Collaborating with design teams to simplify components and reduce variability can help minimize scrap.
6. Production Speed and Volume Pressure
While high-speed production boosts output, it can also increase error rates if the equipment or processes aren’t optimized to handle the pace. Operating at full capacity without adequate quality checks or buffer stages often leads to higher scrap levels.
7. Environmental Conditions
Changes in humidity, temperature, and dust levels can affect material behavior—especially in industries like plastics, food processing, and pharmaceuticals. Sensitive materials may become brittle, expand, or degrade under suboptimal conditions, contributing to scrap.
8. Supplier Reliability and Consistency
Inconsistent supply quality or delayed deliveries may lead manufacturers to work with suboptimal materials or rush production timelines, both of which can increase scrap. Reliable vendor partnerships and strict inbound material inspections help control this variable.
9. Quality Control Systems
The strength and placement of quality control checks significantly influence scrap detection and prevention. If quality control happens too late in the process (e.g., only during final inspection), defective materials that could’ve been caught earlier will still result in waste.
10. Changeovers and Setups
Frequent equipment changeovers, tool swaps, or production line transitions often lead to scrap due to misalignments or incorrect configurations during ramp-up. Proper setup procedures and trial runs can reduce this transitional waste.
By identifying which of these factors are most impactful in your facility, you can take targeted actions to optimize operations, reduce losses, and improve your scrap rate performance over time.
Benefits of Calculating Scrap Rate
Understanding and calculating scrap rate is more than a simple assessment of waste—it's a foundational practice for achieving operational excellence in manufacturing.
Whether you're managing a large-scale facility or a small production line, tracking scrap rate offers measurable and strategic benefits across multiple business functions.
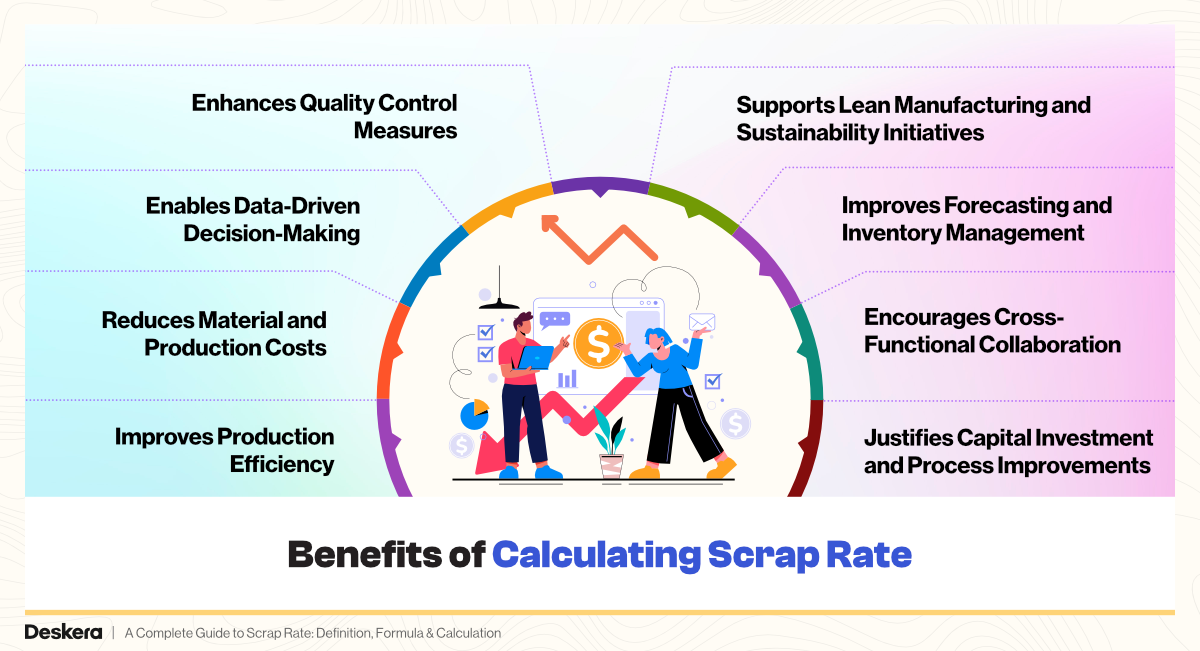
Below are the key advantages in greater depth:
1. Improves Production Efficiency
Scrap rate data enables manufacturers to detect inefficiencies within production workflows. By identifying which stages of the process are generating the most waste, teams can implement targeted changes to reduce downtime, eliminate redundant steps, and optimize throughput.
For example, frequent material rejection during cutting may highlight tool wear or misalignment that, once corrected, can improve consistency and speed across the production line.
2. Reduces Material and Production Costs
Each piece of scrapped material represents a sunk cost in raw inputs, labor, energy, and machine usage. Without accurate tracking, these losses can accumulate unnoticed over time.
Calculating scrap rate helps quantify this loss, making it easier to budget, control expenses, and improve cost-per-unit metrics. Over time, a reduction in scrap rate directly contributes to lower operational costs and higher profit margins.
3. Enables Data-Driven Decision-Making
Scrap rate provides a quantitative foundation for evaluating and improving processes. When this metric is tracked regularly, businesses gain the ability to benchmark performance, identify performance trends, and compare production lines or shifts.
This allows for more informed decisions on staffing, production planning, vendor management, and quality assurance, leading to stronger strategic alignment between departments.
4. Enhances Quality Control Measures
Consistent scrap tracking reveals patterns of defects—whether related to raw materials, machine settings, or human error. By identifying specific points in the workflow where failures occur, manufacturers can implement early-stage quality checks to prevent defective items from progressing further down the line. This not only improves product quality but also reduces rework and warranty claims.
5. Supports Lean Manufacturing and Sustainability Initiatives
Scrap reduction is a key pillar of lean manufacturing practices. Lowering scrap leads to more efficient use of materials, improved inventory turnover, and decreased overproduction.
Additionally, from a sustainability perspective, tracking scrap helps organizations reduce their environmental footprint by minimizing waste generation and conserving natural resources. Many companies also use scrap data to report on ESG (Environmental, Social, and Governance) initiatives.
6. Improves Forecasting and Inventory Management
Accurate scrap rate calculations contribute to more precise material planning. When procurement teams factor in expected scrap levels, they can adjust reorder points and safety stock levels accordingly.
This reduces the risk of material shortages that can halt production or excessive stockpiling that ties up working capital. As a result, businesses maintain smoother operations with less waste and more predictable inventory control.
7. Encourages Cross-Functional Collaboration
Because scrap rate impacts multiple departments—from production and engineering to procurement and finance—it serves as a shared KPI that fosters cross-functional problem-solving.
For example, engineering may collaborate with operations to redesign a component prone to defects, while procurement might negotiate higher-quality inputs to reduce material rejection. This shared visibility encourages teamwork and accountability in waste reduction efforts.
8. Justifies Capital Investment and Process Improvements
When supported by consistent data, a high scrap rate can justify investments in new equipment, training, or automation technologies. Rather than relying on anecdotal evidence, plant managers can present data-driven proposals to senior leadership for improvements that reduce waste, increase output, and deliver long-term ROI. For example, scrap data may reveal the need for a laser-guided cutting machine that significantly improves precision and reduces material loss.
In essence, calculating the scrap rate equips manufacturers with critical insights into their operations. It transforms waste from a hidden cost into a measurable performance indicator—one that enables continuous improvement, financial optimization, and long-term sustainability.
By treating scrap rate as a strategic metric rather than an incidental outcome, businesses can unlock hidden value at every stage of the production cycle.
What Causes a High Scrap Rate?
A consistently high scrap rate is often a sign that something deeper is broken within the production ecosystem. While many factors can influence scrap, not all of them result in excessive waste unless specific weaknesses go unaddressed. This section digs into the most critical root causes behind elevated scrap levels, showing how they manifest—and how they can be resolved.
1. Inefficient or Overcomplicated Processes
Root Cause: Outdated workflows, unnecessary handoffs, or unclear standard operating procedures.
Impact: Complex processes increase touchpoints, making it harder to maintain consistency and increasing the chance of error or damage.
Example: A furniture manufacturer using a five-step manual sanding process found that surface inconsistencies often emerged in step four—due to misalignment between teams using different techniques. Streamlining it to three standardized sanding phases reduced scrap rates by 18%.
2. Machine Wear and Misalignment
Root Cause: Aging equipment, worn-out tooling, or improper machine calibration.
Impact: Even minor inconsistencies in machine settings can result in defective or unusable parts.
Example: In an automotive parts factory, a stamping machine with a worn-out die began producing parts just outside tolerance. Over one month, this resulted in a 6% increase in scrap—until the maintenance team replaced the die and implemented weekly recalibration.
3. Poor-Quality or Inconsistent Materials
Root Cause: Raw materials that don't meet manufacturing specifications or vary between batches.
Impact: Substandard inputs cause defects, process instability, and increased rework or waste.
Example: A textile company noticed higher fabric wastage during cutting operations. Investigation revealed that one vendor’s fabric roll widths were inconsistent, throwing off pattern alignment. Switching suppliers reduced their scrap by 4.2% over the next quarter.
4. Human Error and Inadequate Training
Root Cause: Operators are not adequately trained, especially for specialized tasks or machinery.
Impact: Incorrect machine setup, misinterpretation of instructions, or failure to follow best practices can all lead to scrap.
Example: A small-batch electronics assembler recorded a spike in defective solder joints. It was traced back to new hires who hadn’t been trained on thermal profiles. After retraining the team and introducing visual SOPs, defect rates dropped by 60%.
5. Weak Quality Control Systems
Root Cause: Delayed or poorly implemented quality checks.
Impact: Defects are not caught in time, allowing flawed parts to progress further in the production line and increasing total waste.
Example: A packaging company relied solely on end-of-line inspection. As a result, warped cartons caused downstream jams and had to be scrapped. Introducing in-line sensors and real-time alerts helped reduce defects by intercepting quality issues earlier in the process.
6. Poor Change Management
Root Cause: Lack of alignment between departments during product revisions or process updates.
Impact: Design or process changes are implemented inconsistently, leading to miscommunication and incompatibilities.
Example: A consumer electronics firm launched a new model with updated casing specs but didn’t update the CNC programming on one line. For three days, units were incorrectly milled and scrapped—wasting both material and labor.
7. Environmental and Storage Conditions
Root Cause: Materials exposed to moisture, extreme temperatures, or improper handling.
Impact: Degraded materials can’t be used, and sensitive components may lose functionality or appearance.
Example: A food manufacturer stored packaging near steam vents, causing warping in labels. Moving storage to a climate-controlled area reduced packaging scrap by 8% in one month.
High scrap rates are rarely the result of a single issue. Instead, they emerge from a mix of people, process, equipment, and environmental weaknesses. By identifying and addressing root causes rather than superficial symptoms, manufacturers can drive meaningful reductions in scrap and unlock significant gains in cost savings and quality.
Deskera’s Manufacturing ERP can support this effort by offering real-time data capture, machine-level tracking, and integrated quality control tools—helping companies move from reactive firefighting to proactive process improvement.
How to Reduce Scrap Rate
Reducing scrap rate isn’t just about cutting visible waste—it’s about eliminating hidden inefficiencies, improving quality, and empowering teams to make smarter, data-driven decisions.
A successful scrap reduction strategy blends quick wins (like better sourcing) with long-term process improvements (like automation or predictive analytics).
Below are comprehensive strategies to help manufacturers reduce scrap across the production lifecycle.
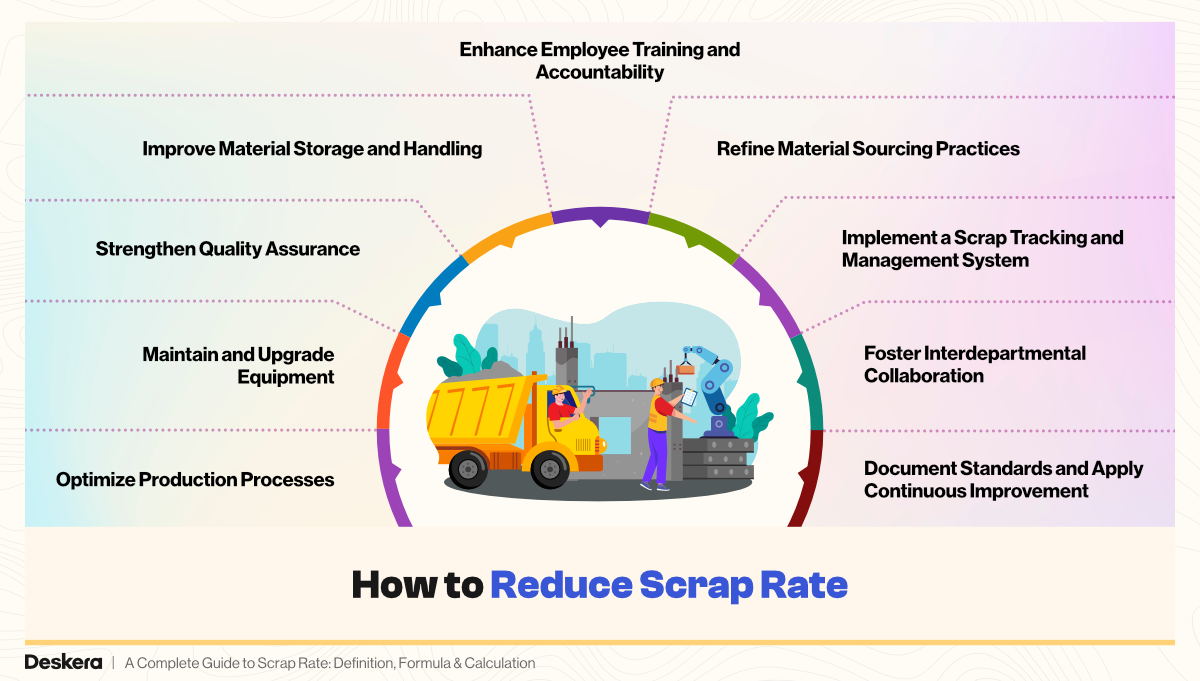
1. Optimize Production Processes
Why it matters: Inefficient workflows, redundant tasks, and manual bottlenecks create waste.
Action steps:
- Automate repetitive tasks to eliminate human error and speed up throughput.
- Rearrange workstations to minimize excessive material movement.
- Introduce AI-powered visual inspection tools to detect early-stage defects.
- Implement real-time monitoring systems to catch inefficiencies as they happen.
Example: A packaging plant used conveyor automation to eliminate manual transfers between assembly stages—reducing handling errors and cutting scrap by 9%.
2. Maintain and Upgrade Equipment
Why it matters: Faulty or poorly calibrated machines are a major source of product defects.
Action steps:
- Set preventive maintenance schedules for all key equipment.
- Use IoT-based condition monitoring to detect issues before they escalate.
- Upgrade machinery when wear-and-tear begins affecting tolerances or outputs.
- Keep tooling and fixtures in proper alignment.
Example: A CNC machining center installed vibration sensors that alerted operators to tool wear, preventing 4% scrap due to imprecise cuts.
3. Strengthen Quality Assurance
Why it matters: Early defect detection limits wasted resources and rework.
Action steps:
- Enforce strict incoming quality checks for raw materials.
- Conduct in-process inspections to catch issues before they compound.
- Calibrate inspection equipment regularly to maintain measurement accuracy.
- Implement statistical process control (SPC) to monitor process variations.
Example: A medical device manufacturer added mid-line visual inspection, catching cosmetic defects early and reducing scrap by 5.6%.
4. Improve Material Storage and Handling
Why it matters: Mishandled, expired, or improperly stored materials often become unusable.
Action steps:
- Establish environmental controls for temperature- or humidity-sensitive stock.
- Use FIFO (first-in, first-out) methods to prevent aging or expired inventory.
- Clearly label high-risk or fragile materials.
- Train warehouse staff on safe material movement.
Example: A facility storing adhesives implemented temperature monitoring to prevent early curing, avoiding monthly scrap losses worth $3,000.
5. Enhance Employee Training and Accountability
Why it matters: Operators who understand the process are more likely to produce consistent, high-quality work.
Action steps:
- Provide hands-on equipment training and job shadowing for new hires.
- Offer refresher training for long-time employees to combat skill drift.
- Encourage operators to report inefficiencies or defect triggers.
- Reward teams for scrap reduction ideas or continuous improvement.
Example: After launching a bi-weekly skill workshop, a bottling plant saw operator errors—and associated scrap—drop by 11% over three months.
6. Refine Material Sourcing Practices
Why it matters: The quality and consistency of input materials directly impact scrap rate.
Action steps:
- Partner with suppliers who offer quality certifications and batch traceability.
- Monitor defect rates by vendor to identify trends.
- Invest in slightly higher-grade materials if they reduce overall waste and rework.
- Include scrap reduction metrics in vendor performance reviews.
Example: A plastics manufacturer switched to a supplier with tighter resin specs, which reduced injection molding defects by 3.8%.
7. Implement a Scrap Tracking and Management System
Why it matters: Without accurate data, it’s hard to identify, measure, or fix the root causes of waste.
Action steps:
- Use an ERP or MRP platform to log all scrap incidents in real time.
- Segment scrap data by line, shift, operator, and material type.
- Generate automated reports to find recurring waste patterns.
- Integrate scrap tracking with costing modules to quantify financial impact.
Example: With Deskera ERP, a manufacturer was able to monitor machine-level scrap trends and reconfigure shift schedules—cutting daily scrap volumes by 15%.
8. Foster Interdepartmental Collaboration
Why it matters: Design, procurement, production, and quality teams must align to eliminate inefficiencies holistically.
Action steps:
- Involve engineers in defect root cause analyses.
- Hold regular review meetings to discuss quality trends and scrap performance.
- Encourage operators to contribute process improvement suggestions.
- Share scrap cost impact transparently with all departments.
Example: When designers, machinists, and QA staff collaborated on a part redesign, they reduced scrap from 7% to 2% in a single production run.
9. Document Standards and Apply Continuous Improvement
Why it matters: Repeatable processes reduce variability and support sustainable results.
Action steps:
- Standardize procedures with visual aids, SOPs, and digital workflows.
- Use lean or Six Sigma tools to identify waste and variability.
- Regularly audit processes to detect drift or inefficiencies.
- Promote a kaizen culture of incremental, employee-driven improvement.
Example: A metalworks plant using 5S visual management saw both worksite clarity and scrap reduction improve measurably over six months.
Reducing scrap rate is not a one-time project—it’s an ongoing effort that spans technology, training, culture, and continuous refinement. By investing in smarter systems, better training, and root-cause problem solving, companies can dramatically reduce waste while improving profitability, product quality, and sustainability.
How Deskera Manufacturing ERP Helps Reduce Scrap and Improve Efficiency
Reducing scrap and optimizing manufacturing operations requires visibility, control, and timely insights—exactly what Deskera’s Manufacturing ERP is designed to deliver. Whether you're a small batch producer or a high-volume facility, Deskera provides powerful, user-friendly tools that empower smarter decision-making across production, procurement, inventory, and quality.
Here’s how Deskera Manufacturing ERP can support your efforts to reduce scrap rate and drive efficiency:

1. Real-Time Production Monitoring
- Track work orders, production status, and material usage in real time.
- Instantly identify when scrap levels spike and trace them back to specific machines, shifts, or batches.
2. Integrated Quality Control
- Set up quality inspection checkpoints at different stages of production.
- Capture defect data and rejection reasons directly within the system to spot recurring issues.
3. Intelligent Inventory Management
- Minimize overstocking and material expiration through dynamic stock levels and reorder points.
- Prevent scrap from perishable or mismanaged inventory using FIFO/LIFO controls and shelf-life tracking.
4. Bill of Materials (BOM) Accuracy
- Create multi-level BOMs with precision to avoid overconsumption or incorrect assembly.
- Standardize material usage to reduce variability and enhance consistency across batches.
5. Machine Maintenance Scheduling
- Proactively plan preventive maintenance and reduce equipment-related scrap.
- Use built-in reminders and performance logs to prevent costly downtime and ensure optimal calibration.
6. Data-Driven Decision Making
- Leverage visual dashboards and detailed reports to monitor scrap trends over time.
- Use KPIs like scrap rate, defect type, and yield percentage to drive continuous improvement.
7. Seamless Supplier and Procurement Management
- Evaluate supplier performance based on defect rates and scrap impact.
- Centralize communication and documentation to ensure materials meet your specifications.
8. AI Assistant “David” for Smarter Forecasting
- Predict material needs and waste patterns with the help of Deskera’s AI assistant.
- Make proactive adjustments to procurement and scheduling to align with scrap reduction goals.
With Deskera, manufacturers gain not only control over current scrap rates but also the insights and tools needed to reduce waste, improve margins, and scale production confidently.
Key Takeaways
- Scrap rate is a vital manufacturing KPI that measures the percentage of unusable or defective materials during production, helping companies evaluate efficiency, reduce waste, and identify quality issues.
- Types of Scrap: Scrap can occur in raw materials, partially processed components, or finished goods. Categorizing scrap helps in pinpointing problem areas and calculating true production costs.
- Why Scrap Rate Matters: Tracking scrap rate enables better quality control, smarter equipment investments, and stronger supplier decisions. It helps align production goals with waste reduction.
- Scrap Rate Formula: The basic scrap rate formula is: Scrap Rate = (Scrapped Material / Total Material Used) × 100. This gives a clear, quantifiable measure of manufacturing waste.
- How to Calculate Scrap Rate: Step-by-Step: Accurate scrap rate calculation involves identifying total scrap, measuring total materials used, and applying the formula consistently using relevant units—mass, units, or value.
- Factors That Influence Scrap Rate: Several internal and external factors—such as operator skill, machine calibration, raw material quality, and process complexity—can significantly affect scrap rates.
- Benefits of Calculating Scrap Rate: Knowing your scrap rate allows for cost reduction, better forecasting, efficient inventory management, and continuous process improvement, all of which contribute to business profitability.
- Root Causes of High Scrap Rate: Common culprits include outdated workflows, machine failures, operator errors, and low-grade raw materials. Identifying these root causes is key to long-term waste reduction.
- How to Reduce Scrap Rate: A holistic strategy combining quality control, equipment maintenance, process automation, staff training, and better material sourcing can significantly lower scrap rates.
- How Deskera Manufacturing ERP Helps: Deskera’s ERP provides real-time tracking, quality control checkpoints, intelligent inventory management, and AI-powered insights to systematically lower scrap and improve production efficiency.
Related Articles
 Niti Samani
 Nalini
 RVJ
RVJ Deskera Content Team
 Niti Samani
 Niti Samani