
Is your factory performing at its best—or are you just hoping it is? The truth is, without the right manufacturing KPIs in place, you’re essentially flying blind. Key Performance Indicators (KPIs) offer measurable insights into your operations, helping you identify what’s working, what’s lagging, and where efficiency, cost, or quality improvements are urgently needed.
In today’s competitive manufacturing landscape, simply tracking data isn’t enough—you need to track the right data. While most manufacturers monitor some form of metrics, many fall into the trap of focusing on too many, too few, or outdated KPIs. The result? Missed targets, bottlenecks, and rising operational costs. The right KPIs not only help you spot inefficiencies but also drive better decision-making across production, inventory, maintenance, and more.
That’s why aligning KPIs with your business goals is crucial. Whether you're aiming to reduce scrap, improve first-pass yield, or enhance overall equipment effectiveness (OEE), choosing KPIs that directly reflect performance and profitability is essential. It’s not about tracking every number—it’s about tracking the numbers that matter most to your bottom line.
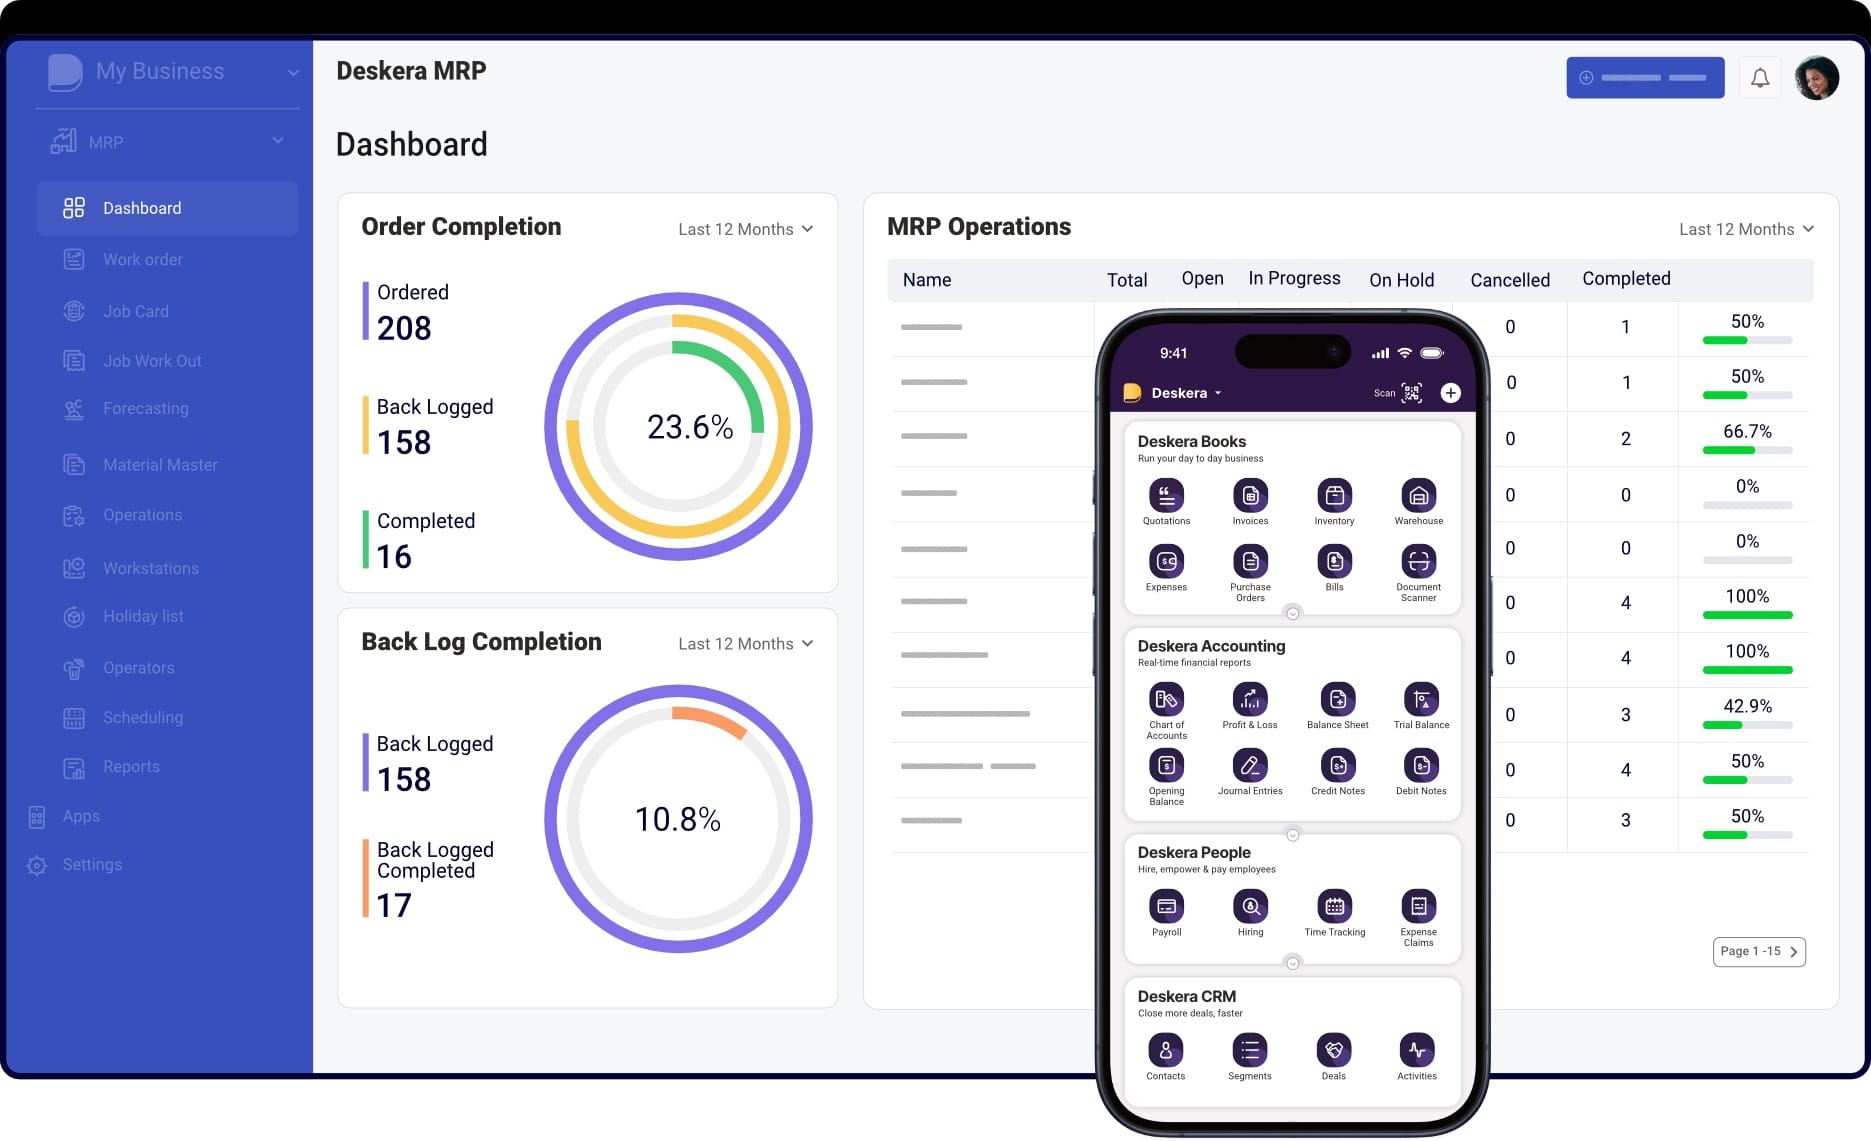
With a powerful solution like Deskera MRP, manufacturers can streamline KPI tracking effortlessly. From real-time production monitoring to automated inventory insights and AI-driven demand forecasting, Deskera offers customizable dashboards that turn raw data into actionable intelligence. It’s designed to help you cut through the noise and focus on what truly drives manufacturing performance.
What Are Manufacturing KPIs?
Manufacturing KPIs (Key Performance Indicators) are quantifiable metrics used to assess the performance of various processes within a manufacturing operation. Unlike general business KPIs, these are tailored to track specific production-related goals—such as efficiency, quality, equipment utilization, and supply chain performance. They help manufacturers evaluate how well their operations align with strategic business objectives.
By continuously monitoring these metrics, manufacturers gain real-time visibility into what's working and what needs attention. Whether it’s tracking cycle time, defect rates, or machine downtime, KPIs help identify inefficiencies, uncover root causes of problems, and support data-driven decision-making. Dashboards and business intelligence tools are commonly used to visualize this data—often color-coded to highlight performance gaps and opportunities for improvement.
More than just numbers, manufacturing KPIs offer critical context for operational success. They allow managers to benchmark current performance against past trends, set realistic targets, and adapt proactively to changes in demand, resource availability, or production challenges. Ultimately, the right KPIs serve as a compass—guiding continuous improvement and sustainable growth in an increasingly complex manufacturing landscape.
Tools like Deskera MRP simplify this process by providing intuitive dashboards and automated reporting capabilities. With real-time tracking of production, inventory, and order fulfillment KPIs, Deskera empowers manufacturers to stay agile, responsive, and focused on what matters most—efficiency, quality, and profitability.
Why Use Manufacturing KPIs?
In today's fast-paced and competitive manufacturing environment, relying on assumptions or outdated reports can lead to costly inefficiencies. Manufacturing KPIs provide the real-time, objective data needed to make smarter decisions and drive continuous improvement across every stage of production.
Here’s why manufacturing KPIs are a must for modern manufacturers:
- Measure what matters: KPIs help you track critical metrics like production efficiency, equipment utilization, and defect rates—so you know exactly where performance is lagging.
- Enable data-driven decisions: With real-time insights, you can respond quickly to issues, adjust workflows, and allocate resources more effectively.
- Identify and reduce inefficiencies: KPIs spotlight hidden bottlenecks, excess waste, or quality problems that may be draining profitability.
- Align teams and goals: Clear, measurable targets keep teams focused and accountable, promoting alignment between shop floor operations and broader business objectives.
- Track progress over time: Monitoring KPIs across weeks or months helps you evaluate strategies, measure ROI, and adapt to operational changes or market demands.
- Turn data into action with the right tools: With platforms like Deskera MRP, manufacturers can automate KPI tracking, visualize performance trends, and gain actionable insights—without manual reporting or guesswork.
How to Identify the Right Manufacturing KPIs
Choosing the right manufacturing KPIs isn’t just about picking popular metrics—it’s about aligning them with your unique goals, processes, and data systems. The KPIs you select should give you both a clear picture of performance and a path to improvement.
Keep these key guidelines in mind when defining your manufacturing KPIs:
- Start with clearly defined goals: Identify what your organization is trying to achieve—whether it’s reducing waste, increasing output, or improving product quality. Select metrics that indicate success against those specific objectives.
- Use SMART criteria for measurement: Ensure each KPI is Specific, Measurable, Actionable, Realistic, and Time-bound. This ensures your progress can be tracked with clarity and purpose.
- Choose a reliable data source: Make sure the data required for each KPI is accessible and accurate. Manufacturing ERP systems like Deskera MRP can capture real-time data, making it easier to track performance and generate reports without delays.
- Prioritize efficient reporting tools: Opt for configurable dashboards that present real-time insights in a digestible format. Centralized reporting helps management stay informed and act quickly.
- Align metrics with strategic objectives: Your KPIs should support broader business goals—like improving delivery speed, increasing market share, or reducing production costs. The right KPIs help monitor the effectiveness of strategic shifts.
- Focus on actionable insights: Good KPIs don’t just highlight problems—they suggest where to act. For instance, breaking down Overall Equipment Effectiveness (OEE) into its components (availability, performance, and quality) helps pinpoint exactly what’s slowing down production.
75 Top Manufacturing KPIs You Must Track
Tracking the right manufacturing KPIs (Key Performance Indicators) is essential for improving productivity, maintaining quality, and maximizing profitability.
These metrics serve as performance benchmarks, help identify inefficiencies, and support data-driven decisions across production, maintenance, finance, and workforce management.
Below are some of the most critical KPIs to monitor in a manufacturing environment:
1. Production Volume
This KPI measures the total number of units produced within a specific time frame, providing insights into your plant’s output capacity and operational performance. Tracking production volume helps you compare current performance with targets and historical data to determine whether you are meeting demand or need to scale operations.
Formula: Total number of units manufactured during a specific period.
2. Production Downtime
Production downtime tracks periods when equipment or production lines are non-operational—both planned (like maintenance) and unplanned (like breakdowns). High downtime affects throughput and profitability. Monitoring this KPI helps identify equipment inefficiencies and informs preventive maintenance strategies.
Formula: Total downtime (planned + unplanned) during a time frame.
3. Production Costs
This metric captures all expenses directly related to manufacturing, including labor, materials, and overhead. It helps identify cost overruns, optimize resource allocation, and improve margins. Understanding per-unit cost is crucial for pricing strategies and cost control.
Formula: Direct labor + Direct material + Overhead costs.
Per-unit cost: Total production cost / Number of units.
4. Overall Equipment Effectiveness (OEE)
OEE is a gold-standard KPI that measures how effectively manufacturing equipment is utilized. It factors in performance (speed), quality (defect-free units), and availability (uptime), giving a comprehensive view of equipment productivity.
Formula: OEE = Performance × Quality × Availability.
5. Overall Operations Effectiveness (OOE)
OOE is similar to OEE but includes scheduled maintenance in its availability calculation, offering a broader view of operational efficiency. It highlights the impact of routine and preventive maintenance on production capacity.
Formula: OOE = Performance × Quality × Availability (includes scheduled downtime).
6. Total Effective Equipment Performance (TEEP)
TEEP measures the maximum potential productivity of equipment if it ran 24/7 without interruptions. It’s a valuable metric for capacity planning and understanding the true productivity ceiling of your assets.
Formula: TEEP = Performance × Quality × Availability (based on 24/7 operation).
7. Capacity Utilization
This KPI evaluates the percentage of your total production capacity that is actually being used. It helps identify underutilized resources and supports decisions on expanding or downsizing production operations.
Formula: (Used capacity / Total capacity) × 100.
8. Defect Density
Defect density monitors product quality by measuring how many defective units are produced relative to total output. A high defect density indicates quality control issues and production inefficiencies that require immediate corrective action.
Formula: Defective units / Total units produced.
9. Rate of Return (ROR)
ROR is a financial KPI used to evaluate the profitability of an investment over time. It helps manufacturers assess the effectiveness of capital investments such as machinery, software, or process upgrades.
Formula: (Current value – Initial value) / Initial value × 100.
10. On-Time Delivery
This KPI tracks the percentage of orders shipped on or before the promised date. High on-time delivery rates enhance customer satisfaction and indicate effective planning, scheduling, and logistics.
Formula: On-time deliveries / Total deliveries.
11. First Time Right (FTR)
First Time Right (FTR) measures how many units are produced correctly without requiring rework or repairs. A high FTR rate reflects process efficiency, strong quality control, and reduced waste. Improving this KPI directly reduces costs and increases customer satisfaction by ensuring consistent product quality from the start.
Formula: Good units / Total units in process.
12. Inventory Turns
This KPI shows how many times inventory is sold and replaced within a given period. Higher inventory turnover indicates efficient inventory management and product demand. It helps manufacturers avoid overstocking or stockouts, ultimately improving working capital and reducing storage costs.
Formula: Cost of Goods Sold (COGS) / Average inventory during the period.
13. Asset Turnover
Asset Turnover measures how effectively a manufacturer uses its assets to generate sales. It’s useful for evaluating operational efficiency, especially in capital-intensive industries. A higher ratio means better utilization of machinery, property, and equipment to drive revenue.
Formula: Net sales / Average asset value.
14. Unit Costs
This KPI calculates the cost to produce one unit of product, factoring in both variable and fixed expenses. Tracking unit costs helps manufacturers analyze profitability, set competitive pricing, and find cost-cutting opportunities. It's essential for budgeting and cost optimization.
Formula: (Variable costs + Fixed costs) / Total units produced.
15. Return on Assets (ROA)
ROA evaluates how efficiently a manufacturing business turns its assets into net income. It’s a key indicator of financial performance and asset efficiency, helping assess how well management uses resources to generate profit.
Formula: Net income / Average asset value.
16. Maintenance Costs
This KPI tracks the total cost spent on maintaining equipment within a specific period. High maintenance costs may indicate aging equipment or poor maintenance practices. Monitoring this helps in budgeting, improving uptime, and evaluating the ROI of equipment upgrades.
Formula: Total maintenance cost / Units produced in the same period.
17. Revenue per Employee
This metric evaluates how much revenue each employee contributes on average. It’s a useful measure of workforce productivity and helps assess labor efficiency across departments or production lines.
Formula: Total revenue / Average number of employees.
18. Profit per Employee
Profit per employee measures the net profit each employee generates. It’s a deeper insight than revenue per employee, showing the true return from human capital after accounting for all operational costs.
Formula: Net income / Average number of employees.
19. Throughput
Throughput measures how many high-quality units are produced and delivered in a given period. Unlike production volume, it focuses only on good units and directly impacts revenue and order fulfillment. It’s a key productivity indicator.
Formula: Good units / Time frame.
20. Work in Process (WIP)
WIP tracks the value of semi-finished goods that are still in production. It helps manufacturers understand production flow, manage bottlenecks, and accurately report inventory on financial statements.
Formula: (Beginning WIP + Manufacturing costs) – Cost of Goods Manufactured (COGM).
21. Overall Labor Effectiveness (OLE)
OLE evaluates how effectively labor contributes to production by factoring in performance, quality, and availability. It provides a deeper understanding of workforce productivity by identifying issues like absenteeism, skill mismatches, or inefficient workflows. It’s useful for workforce planning and improving shop floor execution.
Formula: OLE = Performance × Quality × Availability.
22. Schedule Attainment
This KPI measures how closely actual production matches the planned schedule. A high score indicates efficient planning and execution, while a low score may reveal issues like material shortages, machine failures, or staffing problems. It helps teams evaluate scheduling accuracy and responsiveness to change.
Formula: (Actual output / Target output) × 100.
23. Scrap Material Value
Scrap material value tracks the cost of wasted materials versus the revenue generated from selling scrap. Monitoring this helps manufacturers reduce waste, optimize raw material usage, and increase sustainability efforts. It also highlights areas in need of better process control or material handling.
Formula: Revenue from scrap - Disposal cost.
24. On Standard Operating Efficiency
This KPI evaluates how often labor performs at or below estimated cost levels. It is especially useful in cost-sensitive operations and helps identify where process improvements or employee training are needed. It ensures labor spending aligns with production targets.
Formula: (# Products at or below estimated cost) / Total products.
25. Asset Utilization
Asset Utilization shows how effectively a company’s physical assets (like machines and equipment) are used to generate revenue. Higher utilization means you’re getting more output and value from your existing investments, reducing the need for new capital expenditures.
Formula: (Revenue / Average asset value) × 100.
26. Manufacturing Cost per Unit (Excl. Materials)
This KPI isolates non-material production costs such as labor, energy, and overhead to help pinpoint operational inefficiencies. It helps manufacturers improve pricing strategies, budget planning, and identify areas where automation or process redesign could lower costs.
Formula: (Total manufacturing cost - Material cost) / Total units.
27. Manufacturing Cost as % of Revenue
This KPI compares your total manufacturing expenses to your revenue, providing insight into cost efficiency and profitability. If this ratio is high, it suggests a need for cost reduction initiatives or process improvements to maintain healthy margins.
Formula: Total manufacturing cost / Total revenue.
28. Net Operating Profit
This measures profit generated from core manufacturing operations after deducting operational expenses, interest, and taxes. It’s a strong indicator of business health and operational efficiency, showing whether your core business is financially viable.
Formula: Revenue - Operating expenses - Interest - Taxes.
29. Productivity in Revenue per Employee
A variation of revenue per employee, this KPI helps compare productivity across different plants, teams, or divisions. It reflects both labor efficiency and operational performance, helping identify top-performing units and areas that need support.
Formula: Revenue / Total employees.
30. Average Unit Contribution Margin
This metric calculates how much profit you make per unit after covering variable costs. It’s crucial for pricing decisions, profitability analysis, and prioritizing high-margin products in production schedules.
Formula: (Total revenue - Variable costs) / Units produced.
31. Return on Net Assets (RONA)
RONA measures how efficiently a manufacturer uses its fixed and working capital to generate net income. A high RONA indicates optimal asset utilization and financial discipline. It’s especially useful for evaluating capital-intensive manufacturing operations and comparing plant-level financial performance.
Formula: Net income / (Fixed assets + Working capital)
32. Energy Cost per Unit
This KPI helps assess how much energy is consumed to produce a single unit of product. Rising energy costs per unit may indicate equipment inefficiency or suboptimal production processes. It's vital for sustainability initiatives and cost control, especially in energy-intensive manufacturing sectors.
Formula: Total energy costs / Units produced
33. Contribution Margin Ratio
This ratio indicates the percentage of revenue that exceeds variable costs and contributes to covering fixed costs and generating profit. It's essential for evaluating product profitability, pricing strategies, and break-even analysis. A higher ratio reflects better financial health.
Formula: (Revenue - Variable costs) / Revenue × 100
34. Cash-to-Cash Cycle Time
Cash-to-cash cycle time tracks the number of days it takes to turn a dollar invested in inventory into cash from sales. It covers inventory days (DIO), receivables (DSO), and payables (DPO). A shorter cycle indicates better liquidity and working capital management.
Formula: DIO + DSO - DPO
35. EBITDA
EBITDA (Earnings Before Interest, Taxes, Depreciation, and Amortization) is a key measure of a manufacturing company's operational profitability, excluding non-operating expenses. It helps stakeholders assess the company’s core performance without the effects of financing and accounting decisions.
Formula: Net income + Interest + Taxes + Depreciation + Amortization
36. Projected Customer Demand
This KPI helps manufacturers plan production based on historical usage, market trends, and sales forecasts. It ensures that demand is met without overproducing. By maintaining optimal inventory levels, it reduces carrying costs and improves service levels.
Formula: (Units used daily × Lead time) + Safety stock
37. Employee Turnover
Employee turnover measures the rate at which staff leave the organization over a specific period. High turnover can increase training costs, reduce productivity, and indicate deeper workforce issues. Monitoring this KPI helps HR teams improve retention and maintain operational stability.
Formula: (# Separations / Average number of employees) × 100
38. Reported Health and Safety Incidents
This KPI tracks the number of workplace safety or hazard incidents reported to OSHA over a specific period. Monitoring this helps organizations identify unsafe practices and improve safety protocols to comply with legal requirements and prevent injuries.
Formula: Number of OSHA-reportable health and safety incidents in a defined time period
39. Health and Safety Incidence Rate
Also known as TCIR, this metric calculates the number of OSHA-recordable injuries and illnesses per 100 full-time employees in a year. It helps measure workplace safety performance and compliance with occupational health standards.
Formula: (# of OSHA-recorded cases × 200,000) / Total employee hours worked
40. Reportable Environmental Incidents
This KPI monitors the number of environmental issues reported to the EPA, such as chemical spills, emissions violations, or wastewater issues. It helps manufacturers stay compliant with environmental laws and minimize reputational and financial risks.
Formula: Environmental incidents reported to EPA during a specific time frame
41. Number of Non-Compliance Events per Year
This metric captures the frequency of regulatory or internal policy breaches in a year. Each event should be documented with the time, cause, and resolution. Frequent violations may point to gaps in compliance training or process adherence.
Formula: Total number of non-compliance events in a 12-month period
42. Failed Audit Rate
Measures how many audits conducted during a period revealed compliance failures. A high failure rate may suggest systemic issues in safety, quality, or documentation, and calls for process improvements.
Formula: Failed audits / Total audits conducted
43. Maintenance Unit Cost
This KPI evaluates how much is spent on equipment maintenance per unit produced. It includes all expenses for repairs, inspections, and preventive tasks. Monitoring this helps balance maintenance costs with output efficiency and extend asset life.
Formula: Total maintenance cost / Units produced during the same time frame
44. Mean Time Between Failure (MTBF)
MTBF measures the average operational time between breakdowns for repairable assets. It indicates the reliability of machines—higher MTBF means fewer interruptions and better equipment health.
Formula: Total operating hours / Number of breakdowns
45. Mean Time to Failure (MTTF)
MTTF is used for non-repairable parts like electronics, showing the average lifespan before failure. It's essential for inventory planning and minimizing disruptions caused by sudden part failures.
Formula: Total operating time / Number of failures
46. Percentage Maintenance Planned (PMP)
PMP shows the share of planned maintenance against total maintenance activities. High PMP means your maintenance strategy is proactive, reducing emergency breakdowns and increasing uptime.
Formula: (Planned maintenance hours / Total maintenance hours) × 100
47. Percentage Planned vs. Emergency Maintenance Work Orders
This KPI evaluates how much of your maintenance workload is reactive versus planned. High emergency maintenance suggests inefficiencies and higher costs due to unanticipated issues.
Formula: (Planned maintenance hours / Unplanned maintenance hours) × 100
48. Unscheduled Downtime
Tracks the total time equipment was unexpectedly offline due to failures. It directly impacts production and customer satisfaction. Lower unscheduled downtime signifies effective maintenance planning.
Formula: Sum of all unscheduled downtime during a given time frame
49. Downtime in Proportion to Operating Time
This ratio compares equipment downtime to its total scheduled operating time. It's useful for understanding how much operational capacity is lost to failures or maintenance.
Formula: Downtime / Operating time
50. Avoided Costs
Represents the savings from preventive maintenance by avoiding expensive breakdowns and production losses. This KPI helps justify maintenance budgets and investments in better systems.
Formula: (Assumed repair cost + Production losses) – Preventive maintenance cost
51. Machine Set-Up Time
Measures the time required to configure equipment for a new production run. Reducing this time can significantly increase throughput and operational flexibility.
Formula: Time taken to set up machine for next production run
52. On-Time Delivery to Commit
This KPI tracks how reliably manufacturing meets promised delivery dates. Timely delivery boosts customer satisfaction and reduces the risk of penalties or lost orders.
Formula: Number of on-time deliveries / Total deliveries made
53. Lead Time
Lead time captures the total duration from when a customer places an order to when it's delivered. It includes order processing, manufacturing, and shipping. Shorter lead times improve customer satisfaction and competitiveness.
Formula: Order processing time + Production time + Delivery time
54. Customer Fill Rate
Fill rate shows how well customer demand is met from available inventory. A high fill rate reflects effective demand planning and inventory management, preventing lost sales.
Formula: (Orders delivered / Orders placed) × 100
55. Customer Return Rate
This KPI measures customer loyalty by calculating the proportion of returning buyers. A higher return rate typically signals customer satisfaction and consistent product quality.
Formula: (Returning customers / Total customers) × 100
56. Customer Satisfaction
Customer satisfaction is gauged using survey responses, often via a Likert scale. It gives insights into product quality, service experience, and overall brand perception, guiding improvement efforts.
Formula: (Satisfied respondents / Total surveys filled) × 100
57. Yield
The efficiency of raw material usage by comparing actual output to the theoretical maximum possible output.
Formula: (Actual number of products manufactured / Theoretical maximum possible yield based on raw material input) × 100
58. Cost of Poor Quality (COPQ)
Total financial losses due to quality failures—includes both internal (scrap, rework) and external (returns, warranty claims) costs.
Formula: Internal failure costs + External failure costs
Alternate formula: COPQ = Final production cost − Minimum expected production cost
59. Rework Rate
Percentage of total products that required additional effort to meet quality standards.
Formula: (Number of reworked units / Total number of units produced) × 100
60. Rejection Rate
The proportion of finished goods that failed final inspections and cannot be sold or used.
Formula: (Number of rejected units / Total units inspected) × 100
61. Perfect Order Percentage
The percentage of orders delivered without errors, delays, damages, or documentation issues.
Formula: (% Orders on time) × (% Complete orders) × (% Damage-free orders) × (% Accurate documentation) × 100
62. Customer Reject Rate
The percentage of specific parts (not full units) that are rejected by customers after delivery.
Formula: (Number of rejected parts / Total parts in all delivered products) × 100
63. Supplier's Quality Incoming
The proportion of incoming raw materials from suppliers that meet required quality standards.
Formula: Number of quality raw materials received / Total incoming materials
64. Scrap Rate
The amount of raw material wasted during the manufacturing process.
Formula: Amount of scrap material / Total material input
65. Cycle Time
The average time taken to fulfill a customer order from placement to delivery.
Formula: (Time order received − Time order placed) / Total number of orders shipped
66. First Pass Yield (FPY)
The percentage of products that meet quality standards the first time through production without rework.
Formula: Number of non-defective units produced on first attempt / Total units produced
67. Machine Downtime Rate
The percentage of total machine time lost due to planned or unplanned downtime.
Formula: Total downtime / (Total uptime + Total downtime)
68. Material Yield Variance
The difference between the actual and standard material usage, multiplied by standard unit cost.
Formula: (Actual unit usage − Standard unit usage) × Standard cost per unit
69. Overtime Rate
The proportion of total hours worked that were overtime.
Formula: (Overtime hours / Total hours worked including overtime) × 100
70. Production Attainment
The ability to meet scheduled production goals within a defined period.
Formula: (Actual production / Scheduled production) × 100
71. Changeover Time
The average time required to switch a production line from manufacturing one product to another.
Formula: Total changeover time / Number of changeovers
72. Takt Time
The maximum amount of time available to produce a product to meet customer demand.
Formula: Total available production time / Average customer demand
73. New Product Introduction (NPI) Rate
The frequency of launching new products within a specified period.
Formula: Number of new products introduced / Targeted number of new product launches
74. Engineering Change Order (ECO) Cycle Time
The time taken to implement an engineering change after the order is received.
Formula: Average time (in days/weeks/months) from ECO receipt to implementation
75. Return on Innovation Investment (ROII)
The profitability of investments in innovation (e.g., R&D or process improvement).
Formula: (Net profit from innovation / Total innovation investment) × 100
How Deskera MRP Helps You Improve Manufacturing Efficiency and Quality
Deskera MRP (Material Requirements Planning) is a comprehensive solution designed to streamline every stage of the manufacturing process—from planning and procurement to production and quality control. Here’s how it supports manufacturers in improving KPIs like yield, first pass quality, rework rate, and more:
Real-Time Production Tracking
Deskera gives you full visibility into your shop floor operations. You can monitor production progress, track machine downtime, and analyze cycle times in real time—helping you detect bottlenecks early and improve production attainment.
Integrated Quality Control
With built-in quality checks at each stage of the manufacturing process, Deskera helps you track first time yield, rework rate, and rejection rate. You can set quality benchmarks, automate inspections, and log defect data to identify trends and prevent future issues.
Automated BOM and Material Planning
Deskera ensures you never over- or under-produce. Its smart BOM (Bill of Materials) and MRP engine calculates precise material needs based on demand forecasts and existing inventory, minimizing scrap rate and improving material yield variance.
Production Scheduling and Changeover Optimization
The platform lets you automate and optimize your production schedules, reducing changeover time and ensuring on-time delivery. You can also manage batch sizes and order priorities more effectively.
Supplier and Inventory Management
Track supplier quality performance and manage incoming inspections directly within Deskera. With real-time inventory updates, you can reduce lead times, minimize RMAs, and keep your warehouse lean.
Analytics and KPI Dashboards
Deskera's advanced reporting dashboards let you monitor all your manufacturing KPIs—from yield and takt time to machine downtime and ROII—in one place. This data-driven approach enables continuous improvement.
AI Assistant "David" for Smart Recommendations
Leverage Deskera’s AI assistant, David, to get proactive alerts, process recommendations, and anomaly detection based on your operational data—helping you respond faster to problems and reduce COPQ.
In short, Deskera MRP empowers manufacturing leaders to gain control over processes, reduce costs, maintain high product quality, and improve delivery performance—all from a single, cloud-based platform.
Key Takeaways
1. Manufacturing Compliance Metrics
- Reported Health and Safety Incidents help track regulatory compliance and workplace hazards.
- Health and Safety Incidence Rate shows injury frequency, enabling better risk prevention.
- Reportable Environmental Incidents measure environmental impact and adherence to EPA regulations.
- Number of Non-Compliance Events per Year reveals how often plants violate regulatory guidelines.
- Failed Audit Rate highlights how frequently manufacturing operations fall short of compliance standards.
2. Maintenance Manufacturing Metrics
- Maintenance Unit Cost helps evaluate the cost-effectiveness of maintenance programs.
- Mean Time Between Failure (MTBF) is critical for understanding equipment reliability.
- Mean Time to Failure (MTTF) tracks lifespan of non-repairable components.
- Percentage Maintenance Planned (PMP) reflects how well-prepared your maintenance operations are.
- Percentage Planned vs. Emergency Maintenance Work Orders shows how proactive your maintenance strategy is.
- Unscheduled Downtime uncovers hidden losses from equipment issues.
- Downtime in Proportion to Operating Time indicates how often machines are unavailable.
- Avoided Costs measure savings from preventive maintenance over reactive repairs.
- Machine Set-Up Time affects overall production efficiency and throughput.
3. Customer Experience & Responsiveness Metrics
- On-Time Delivery to Commit reflects production reliability and delivery performance.
- Lead Time measures end-to-end order fulfillment time, crucial for customer satisfaction.
- Customer Fill Rate indicates how effectively inventory meets demand.
- Customer Return Rate tracks loyalty and product satisfaction.
- Customer Satisfaction gauges how well customer expectations are being met.
4. Quality Management Metrics
- Yield measures the efficiency of raw material conversion into finished goods.
- First Time Yield reflects process quality and minimization of rework.
- Cost of Poor Quality (COPQ) captures the financial impact of internal and external failures.
- Rework Rate identifies inefficiencies and additional costs due to defects.
- Rejection Rate reveals product quality issues at the final inspection stage.
- Perfect Order Percentage helps assess fulfillment excellence across time, quality, and accuracy.
- Customer Reject Rate tracks defects at the part level, useful for product-level quality checks.
- Supplier’s Quality Incoming ensures raw material quality is aligned with standards.
- Scrap Rate measures material waste and manufacturing efficiency.
5. Lean Manufacturing Metrics
- Cycle Time shows how responsive your operation is to customer demand.
- First Pass Yield acts as an early quality indicator for potential production flaws.
- Machine Downtime Rate identifies inefficiencies from machine unavailability.
- Material Yield Variance highlights deviations from material usage standards.
- Overtime Rate indicates labor strain and potential inefficiencies in workforce planning.
6. Performance Metrics
- Production Attainment shows how well actual production aligns with scheduled targets.
- Changeover Time reflects flexibility and agility in handling product transitions.
- Takt Time ensures production pace matches customer demand rhythm.
7. Manufacturing Innovation Metrics
- Rate of New Product Introduction (NPI) measures how often innovation reaches the market.
- Engineering Change Order Cycle Time shows how quickly design or process changes are implemented.
- Return on Innovation Investment (ROII) quantifies the profitability of innovation initiatives.
Related Articles
 Niti Samani
 Niti Samani
 Niti Samani
 Niti Samani
 Niti Samani
 Niti Samani