

“Do I have to be tech-savvy to conquer the Google Analytics process?”
This is the exact thought that popped up in my mind when I planned to learn about Google Analytics. Despite that concern, I gave it a shot and explored this intriguing platform.
Well, trust me! At first, Google Analytics may seem intimidating. However, once you've grasped each concept slowly and gradually, you'll find it rather simple to apply it to everything from basic websites to larger businesses.
And, here’s the best part— Google Analytics is Free! So, that makes it even Perfect, isn’t it?
In today’s Google Analytics topic, we will cover all major aspects associated with it. Without any further ado, let’s check the table of content:
- What’s Google Analytics?
- Brief History of Google Analytics
- Segments of Google Analytics
- Need of Google Analytics
- Understanding Google Analytics4
- Setting up Google Analytics
- Navigating Google Analytics
- Types of Hits that Google Analytics Measure
- Why do You Need to Prefer Google Analytics?
- Frequently Asked Questions (FAQs) on Google Analytics
Let’s delve in!
What’s Google Analytics?
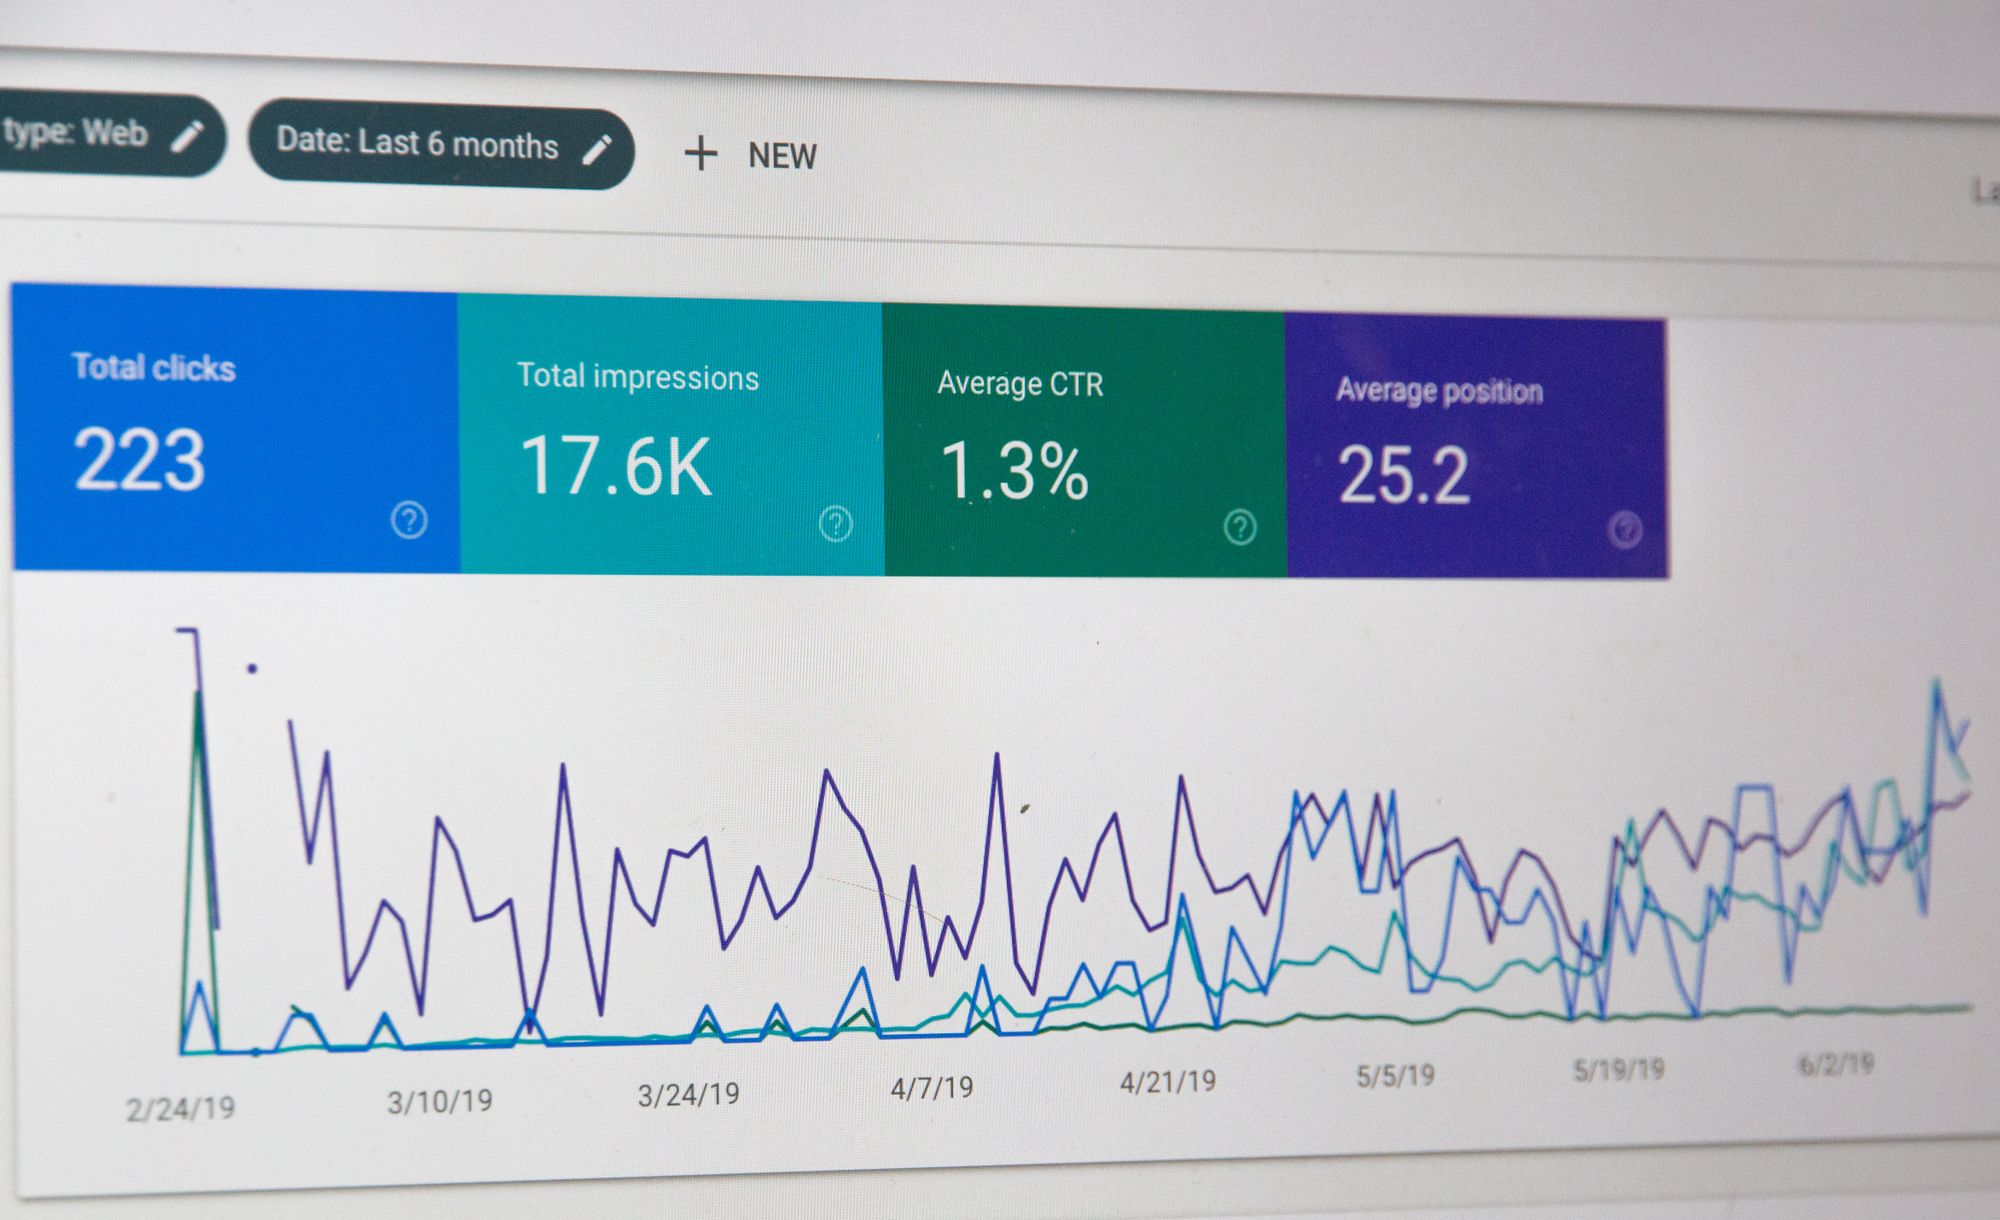
Google Analytics is a free analytics platform that tracks, collects, and reports data based on how visitors interact with your website.
When Google Analytics collects data, it filters it into easy-to-understand interactive insights. Moreover, it comes under several Google tools, including Google Tag Manager and Google Search Console.
The best features of Google Analytics include the real-time audience, campaign tracking functionalities, goal setting, and acquisition & behavior reporting.
As a result, the Google Analytics platform provides a comprehensive view of your website's performance. It collects a large dataset and analyses it properly.
Furthermore, it also gives reports that you may use to view the data. You can gain knowledge about your website and the individuals that frequent it by looking at those statistics.
After acquiring Urchin, a site analytics program, Google released the service in November 2005. Since then, Google Analytics has grown in popularity as the most widely used online analytics tool.
Brief History of Google Analytics
The data on websites wasn't always simple or easy to understand. Previously, people had to inspect their server logs to find out how much traffic their site received. The server log would spit out a set of details for each action performed on the website. While the material was useful, it was hard to decipher.
Companies started compiling log files and creating reports based on the available data to make things a little easier.
Urchin, a startup that created reports from log files, surged in prominence quickly and attracted a wide range of audiences. As a result, Google purchased Urchin in 2005 and began the process of developing and branding Google Analytics.
Segments of Google Analytics
A segment is a sub-division of analytics data. Furthermore, segments assist you in separating and understanding subsets of data in order to study business patterns.
For instance; whether you notice that customers from Gurgaon have stopped using your service recently, you can investigate whether your local competition has launched a campaign or if your local page has any technical issues.
Types of segments:
- Sessions: It covers all sessions that were generated from a specific marketing campaign, pricing page session, and more.
- Users: It covers audiences who have purchased something on your site, users who have joined for a consultation, etc.
- Hits: It covers all hits with a purchase, all hits with a certain product included in the cart, and more.
Need of Google Analytics
Google Analytics could be utilized for multiple purposes. Following we have discussed and reviewed three prominent applications of Google Analytics. Let’s learn:
Improve and Enhance Site Performance
Analytics reports definitely work as a perfect way to discover more about your website and its visitors. Check the listed questions that the platform can assist you to answer in this domain:
- Which of my pages receives the most visitors?
- The reason why visitors exit my website?
- Are visitors using smartphones seeing longer loading times?
- How quickly do my site loads?
The above-mentioned insights help to find some of the major practical methods to improve your website. You might establish a more particular aim rather than a generic goal of increasing traffic.
For example, you may find that your blog posts generate a lot of visitors, indicating that producing more of them and actively promoting them could help you increase traffic much more.
Marketing
Analytics data can be really useful in determining how to optimize your marketing. The data you've obtained can help you solve a range of questions about your marketing efforts, including:
- Which websites get the higher traffic from referrals?
- How much traffic does each marketing channel bring to your site?
- What countries do your site's visitors hail from?
- What’s the conversion rate of users on your website?
As a result, the responses can assist you in better targeting your marketing initiatives. They can suggest which channels you should invest in and which you should skip. Moreover, they may also assist you in better defining your target demographic, among other things.
Search Engine Optimization (SEO)
Google Analytics data might also assist you in improving your SEO. Moreover, the system can help you answer a range of questions about how users find and interact with your website:
- How much of your website's traffic is generated by search engines?
- What are the most common keywords terms visitors use to locate your website?
- Which among your landing pages has the highest number of visitors?
- What's your bounce rate for users that visits from a variety of different places?
To effectively get the best of SEO—Knowledge is highly important. When you have information on every aspect, then you can easily decide your target users and market.
Undoubtedly, Google Analytics is a program that offers a wealth of information. It might help you increase the ROI you see from your SEO efforts if you can access and evaluate the right reports.
Understanding Google Analytics4
In October of 2020, the Google Analytics platform received its most recent update. Google Analytics 4 is a new approach to App + Web properties that combines all data into a single stream. GA4 also places a greater emphasis on machine learning, with the goal of assisting analysts with forecasting through predictive modeling.
This version of Google Analytics is still relatively new, and it has not yet gained widespread adoption. We do, however, recommend putting up GA4 as quickly as possible because GA4 does not import data obtained from Universal Analytics.
Setting up Google Analytics
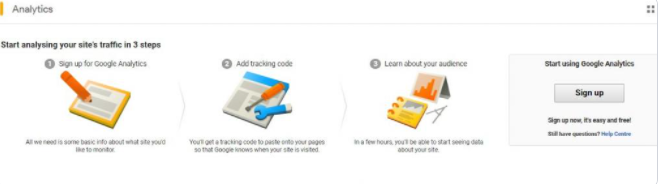
Configuring google analytics is a simple and easy method. We have listed down the entire process in simple steps. Make sure you follow them to effectively set up Google Analytics. Let’s follow:
1. Generate Google Analytics Account
To set up a Google Analytics account, you must use an existing Google account or establish one, just like most other platforms inside the Google Marketing Platform brand.
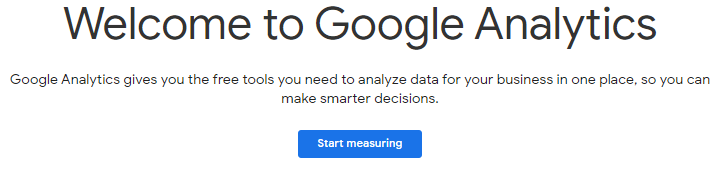
- If you already have a Google account, then go to: https://analytics.google.com/analytics/web/
- Now, log in using your Google Account. Then, tap on the ‘Set up for free’ button.
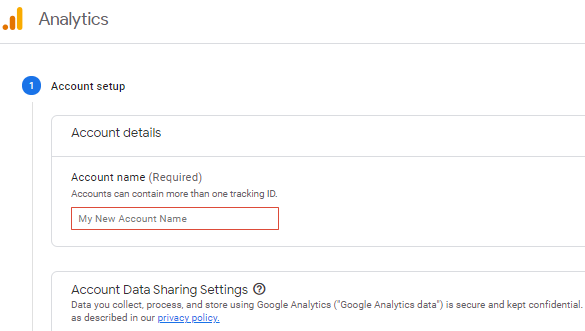
- Enter the account name and personalize the necessarily recommend option tick list. Now, tap on the ‘Next’ option.
- Choose the device(s) that you want to measure. Tap on ‘Next.’
- Input your website name and URL. Choose the appropriate industry category.
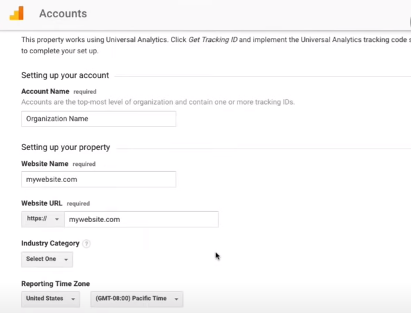
- Update the time zone and location as necessary. Click on ‘Create.’
- Accept the terms and conditions. And, you are good to go!
2. Installation of Tracking Code
Once you have set your account. Then, you have to add a tracking link, which helps to enable site/app data tracking. Moreover, your tasks may vary depending on the platform you’re utilizing.
For instance; if your website is self-coded, then one method to do this is to paste your global site tag after the head> tag on each page that you want to track.
After you've agreed to the terms and conditions, you'll be taken to a page where you can add a tracking link.
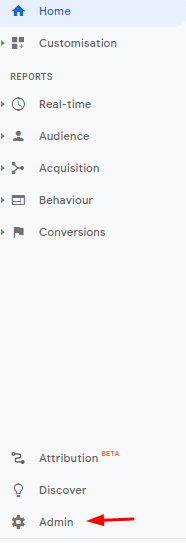
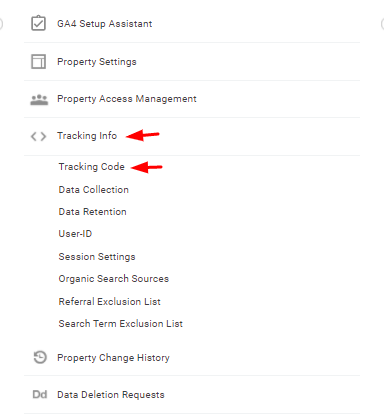
Alternatively, go to the bottom left-hand side of your screen and choose the 'admin' button, then 'Tracking info', then 'Tracking code.'
Check the following example of how to install the tracking code on a WordPress website in only a few clicks below:
- Log into WordPress Dashboard
- Install a Web Analytics Plugin (Recommended: Monster Insights)
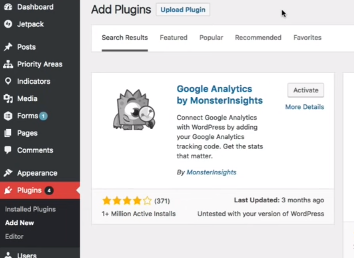
- Tap on ‘Install Now’
- Tap on ‘Activate’
- Start the setup process and follow the on-screen instructions
- Tap on 'Connect MonsterInsights'
- Log in with your Google Account through which you generated your account
- Now, optimize as necessary
- Tap on ‘Allow’
- Select ‘Save and Continue’
- Tap on ‘Finish Setup and Edit Wizard’
Yay! You finally finished your setup process.
3. Know your Audience
Once you have established your account and installed the tracking code. Then, you can start tracking your marketing performance. Furthermore, make sure to test everything to know if they are working exactly as they should. Check the following section:
- In your browser, start an incognito window and type the name of your website.
- Reload the Google Analytics dashboard.
- You will now be able to view both the active user (you) and any additional users to your site.
Congrats, you can now effectively obtain the best of Google Analytics.
Navigating Google Analytics
As we have learned how to set up Google Analytics. Now, let’s learn its associated insights:
Homepage
This is the primary page that you will see when you will sign in to Google Analytics.
Further, the initial part provides an overview of your audience data, comprising sessions, traffic volume, bounce rate, current site visitors, and the pages they are actively browsing. This data is categorized into three pieces or 'cards.'
As you continue down, you'll see additional important details like how you get traffic to websites, where they're from, what devices they're using, what pages they're looking at, goal completions (if you've set any), and so on.
You will find everything inclusive on the Homepage itself.
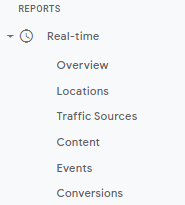
Real-time Report
The very first report option is the real-time report. The navigation menu tabs give you information about the latest visitors to your website, such as where they came from, what pages they're looking at, and so on.
Top tip: While it's amazing to learn about the latest visitors, you'll probably find that other statistics that allow you to look at traffic volume and behaviour over longer time periods, such as weekly, monthly, or quarterly, are more beneficial.
Let’s learn about real-time report elements:
#Locations
Here, you can check your current user’s location. It simply provides you the information on visitors' location, which page they are on, and the amount of time they spent on that page.
#Traffic Sources
In this report, you will find how exactly your audience reached on your website. It could be through a Facebook link, entering your website URL, or other ways.
This portion can be quite useful in real-time if you want to see how much traffic a new social post is generating or how well a new landing page is performing.
#Content
This part gives you information on where visitors come from and how long they remain on your website.
On a specific page, you may view the title, URL, and Percentage of active users.
#Events
This section helps to monitor customizable interactions that visitors make with your website in real-time.
Some of the major examples include— white paper downloads, Ad clicks, and video views.
You can further tailor data by browsing "Events (Last 30 min)" to see what has happened in the last half hour, or by selecting an event category to see what has happened in that category.
#Conversions
This report provides you with that information in real-time.
Discover the most prominent goals, as well as the number of visitors who finished them and the proportion of users who did so, in real-time or during the last 30 minutes.
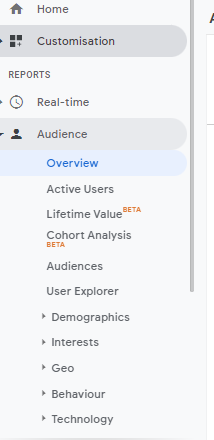
Audience Report
This report gives you an overview and in-depth information about your audience's metrics. It further includes geolocation, demographics, and device usage, among other things.
Moreover, it's worth familiarizing yourself with the individual drop-down tabs and obtaining the information you desire by tapping on them.
Check the associated elements of the Audience Report:
#Active Users
Over this length of time, how many users were actively engaged on your site?
The active user's data in Google Analytics can help you evaluate your website's retention rate. It further shows how frequently visitors return to your website over a specified period of time.
Depending on your campaign's needs, you can change the time period to daily, weekly, bimonthly, or monthly.
Although, daily is the default option. And this simply estimates the number of users who visit your website on a daily basis.
#Lifetime Value
Do you have any doubts about the value of the leads you obtained from an email campaign? Are you debating whether it's worthwhile to devote additional resources to social media?
Then, a lifetime value report comes to your rescue. It helps to evaluate the long-term value of visitors. These visitors are acquired from certain channels such as organic, referrals, social, and direct.
Each acquisition pageviews, audience's average goal completions, revenue, and other metrics can then be analyzed.
#Cohort Analysis
This is a group of users who are linked by a common trait, such as users who were acquired on a particular day.
This analysis allows you to examine a range of cohort-related statistics.
A cohort could be defined as the day a new course was launched, for example. You may then see information on users who engaged to your launch, such as where they live, whether or not they used a tablet, whether or not they purchased something, and so on.
#Audiences
Is there a report on the audience within a report on the audience? That's right, you read that correctly.
You can use this area to generate more specific audiences and deploy them to different portions of your analytics report.
At any given moment, you can build and apply up to 20 audiences.
#User Explorer
User-specific data can reveal what prompted a visitor to make a larger-than-average transaction or what steps they did before departing their cart.
View information such as average session time, bounce rate, revenue, and goal conversion rate for each user.
#Demographics
This option allows you to see extensive data about your users' ages and gender.
For example, you may observe the average session time of women aged 25 to 34 over a period of time.
This data can be used to better adapt content, advertisements, and other marketing activities.
You can also build divisions and remarket customers based on these criteria.
#Interests
Do you want to reach out to tech-savvy users? Or are you a fan of Asian cuisine?
It's feasible due to this portion of Google Analytics.
You'll need to enable remarketing and advertising reporting features to get started.
Further, when you’ve enabled it, then you can explore data about users, and that depends on:
- In-market Category: It is mainly based on the interests of the audience in terms of goods and services. For example; Product-related interests such as baby care, traveling, or more.
- Affinity Categories: Users can be targeted to create awareness based on their passions. It also includes their behaviours and interests. For example; cosmetics, the latest gadgets, and more.
- Other categories: Examples include pet dogs, hair care products, and so on.
Eventually, this data is very beneficial for remarketing strategies.
#Geo
This report provides you with information about your visitors' location and language. Moreover, this information can be utilized to improve the quality of future initiatives or generate new leads.
#Behaviour
This analysis can assist you in finding out if new people are coming back to your site to interact with the information.
Furthermore, you can evaluate statistics based on three divisions:
- Frequency & Recency
- New vs. Returning
- Engagement
Furthermore, you can utilize this information to determine whether a new buyer's guide, for example, is enticing customers to return, showing that they are progressing through the buying cycle.
#Technology
This report provides you with more information about how users interact with your site, such as the browser and operating system they use, as well as what connection they use to access the internet.
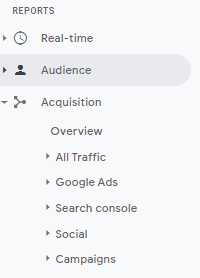
Acquisition Report
The acquisition report is based on the several types of traffic that come to your website, such as social, organic, Google advertisements, and so on.
Moreover, you can define and examine certain time periods. It includes periods such as weekly and monthly reports. Furthermore, this is especially valuable for assessing performance over extended periods of time, comparing results, and establishing goals.
Pro advice: You can also add new traffic sources, such as email, to improve the accuracy of the acquisition data.
Check the following elements associated with the Acquisition report:
#All Traffic
The sites that provide you with the most traffic are listed in this report.
The data on the actions such users perform, such as Pages per Visit, Goal Completions, Bounce Rate, and so on, may then be viewed.
Further, there includes two sub-categories— Channels and Source/Medium in which the data can be divided into.
Moreover, if you go deeper into the Source/Medium area of Google Analytics, you can see how much traffic comes from image searches.
Pro Tip: You may put a monetary value on your organic traffic by contrasting how much a keyword costs in a Google Ads Campaign to how much a term costs in an organic search.
#Google Ads
If you're spending money on Google Ads, you'll need this information to figure out how well you're doing.
Integrate your Google Ads and Analytics accounts to get started. Then you can look at information about:
- Campaigns
- Search queries
- The hour of the day
- Keywords
- Final URLs
#Search Console
This aids in determining how well your website succeeds in organic search. You must, however, connect Google Analytics and Google Search Console initially.
You'll have access to a lot of data once you're connected, and you'll be able to arrange it by subcategories like Landing Pages, Countries, Devices, and Queries.
This can be used to help you prioritize your tasks.
For instance, find articles that rank well yet have a poor click-through rate. Then, that content might generate a lot of traffic with a few adjustments.
#Social
The Social tab displays how people on social media are responding to your content.
Sort the results by:
- Landing Pages
- Conversions
- Referrals from the network.
- Users Flow
- Plugins
Furthermore, you can use this information to find platforms where your readership is already engaged with your content. Moreover, you can also assess how social media is influencing site behaviour.
#Campaigns
The Efforts report compares funded campaigns to other projects and demonstrates how they succeed.
Sort the data using the following criteria:
- Paid keywords
- Campaigns.
- Organic keywords
- Cost analysis
If you input the cost data, you may even compare stats for non-Google campaigns.
Behaviour Report
The user behaviour report gives you valuable information about how people engage with your site and its information. Google gives crucial recommendations to help you enhance performance, from the length of time people spend on the site to the material they read.
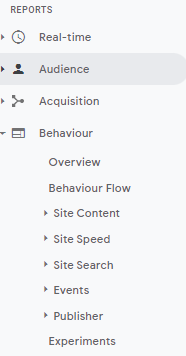
Check the following elements associated with Behaviour Reports:
#Behaviour Flow
This report depicts the user's journey across your website. You must first create and monitor Events in order to use this report.
#Site Content
This provides detailed information such as whether visitors were on mobile, whether they completed a purchase, whether the traffic was organic, and so on.
This information aids you in determining whether a certain piece of content is performing successfully.
This Google Analytics report works as the jackpot for content marketers. This data helps me figure out which blog titles are the most popular.
Follow these procedures to determine the best-performing titles:
Go to Behavior > Site Content > All Pages in Google Analytics.
As the primary dimension, select Page Title.
#Site Speed
This report displays how quickly content loads and may be sorted by traffic source, indicating whether mobile consumers have a longer load time, for example.
To get the most out of this report, we recommend creating custom reports, such as this one from LunaMetrics that reveals which browsers take the longest to download.
#Site Search
This report reveals how users use your site's search feature.
With this data, you can identify key terms for which you should optimize your content or identify gaps in your material.
Custom reports are useful in this domain as well.
#Events
"User interactions with content that may be tracked independently from a web page or a screen load," according to Google Analytics.
Downloads of PDFs, video views, form submissions, and other activities are examples of events.
Segregate this report using the following criteria:
- Top occasions.
- Event flow
- Pages.
#Publisher
The Publisher Report provides information on how your website is monetized, such as impressions and clicks.
A link to AdSense or Ad Exchange is required for this report.
After that, you can look at information about Publisher Pages and Publisher Referrers.
#Experiments
Experiments allow you to test different versions of your site, such as whether your new welcome message converts better than your previous one.
Although, it has been replaced by Google Optimize, which appears to be a more effective platform.
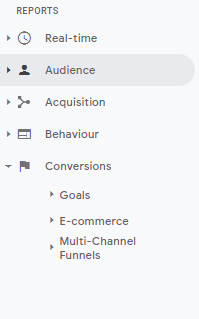
Conversions Report
This report compares your outcomes to the objectives you set. You can check when people engage and convert in the activities you need them all to participate in. In this section, you can additionally optimize and prioritize goals.
Note: We'll go through how to set and track objectives further down in this article.
Check the following elements associated with the Conversions Report:
#Goals
This includes the acts that you wish to keep track of.
Furthermore, this report provides detailed information about user actions based on the objectives you set.
To identify what activities lead to broader actions, you can create both micro and macro goals.
Establish a Goal first, then look at the statistics based on:
- Reverse Goal Path
- The Goal URL
- Funnel Visualization
- Goal Flow
#E-Commerce
The Ecommerce report can be filtered by the following criteria:
- Transaction.
- Product.
- Sales.
- Times to Purchase.
To access this data, you must include the eCommerce code snippet on your website.
#Multi-Channels Funnels
It's hard to ascertain what's working with your audience when there are so many options.
This paper delves into how various channels contribute to your funnel's success.
To begin, place the eCommerce snippet on your website. After that, you can keep track of:
- Top Conversion Paths
- Assisted Conversions
- Path Length
For eCommerce firms tracking social media conversions, We like to utilize the multi-channel funnels assisted conversions report.
Important Features
We'll go through some of the most important features and functionality that will enable you to obtain the benefit of Google Analytics:
#Establishing a new objective
Goals track how users perform in relation to the actions you want them to do, and they're reported in the Conversions report. To create a new goal, follow these steps:
- Go to the dashboard’s bottom left-hand corner and choose the admin option.
- Tap Goals in the ‘VIEW’ column.
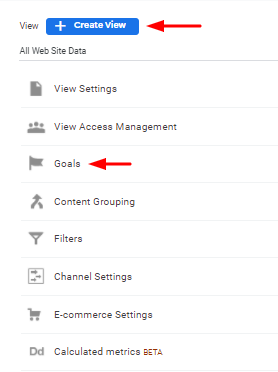
- Establish a new goal by clicking + NEW GOAL or Import from Gallery, or update an existing goal by clicking it.
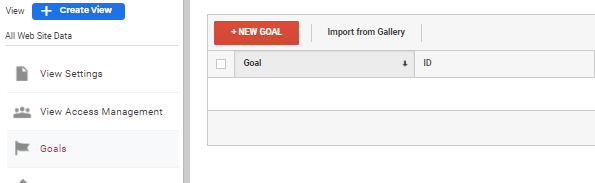
You can use a goal template to set up a goal, or you can build a Smart Goal or custom goal.
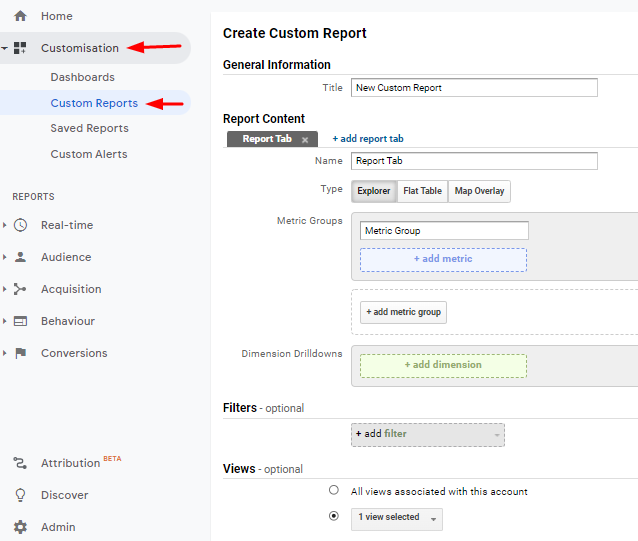
#Custom Reporting
This reporting on Google Analytics makes it simple to obtain the information you need. Here's how you can make your own report:
- Select the Customization option.
- Choose Custom Reports from the dropdown menu.
- Select '+New Custom Report' from the drop-down menu.
- After that, you can create and name a new report, as well as organize the content you want to see in it.
Types of Hits that Google Analytics Measure
Following we have listed three types of hits associated with Google Analytics tracking. Let’s check:
1. Event Hit
A hit is delivered when a viewer takes an action on your website. For example, subscribing, clicking on links, filling out forms, watching any videos, and more.
2. Pageview Hit
When someone views one of your pages, a hit is sent. It includes information such as the connected devices and browsers utilized by viewers. You can also check which pages on your site users visit.
3. E-Commerce/Transaction Hit
A hit is sent when a site visitor makes a transaction. These hits could include information like the pages the visitor looked at before making a purchase. Simpler information is also provided, such as what they bought and how much they invested.
Why do You Need to Prefer Google Analytics?
The most interesting fact about Google Analytics is that it’s Free. If you own a website and wish to start a small or medium-sized business. Then you can use Google Analytics to its full potential.
Furthermore, you will obtain various resources on Google Analytics that cover almost every aspect. It will further help you to learn about your audience, tracking, conversions, and so much more. Additionally, Google Analytics is accessible for all users of any level.
Another benefit is that Google Analytics is beneficial to analysts of all skill sets. Furthermore, Google Analytics allows you to conduct a higher-level examination of your site's effectiveness. You also have the option of doing a more in-depth investigation.
Not only can you see which marketing channels are driving traffic to the website, but you can also see which marketing channels are driving traffic away from your site.
However, you can observe which sites people visit at varying periods of the day, what landing page they land on, and how long it takes for the page to load for them.
Of course, everyone wants information from the world's largest search engine on their website. As search engine marketers, we invest a lot of time trying to please Google.
Therefore, it's tremendously advantageous for strategic planning to have a system that can provide us with all the information Google is tracking on our site.
Undoubtedly, when you have the right tools, then you know what are the key areas where you need to focus on to enhance your website performance. You'll be able to make improvements to your site with a data-driven plan rather than depending simply on intuition if you use the numbers in Google Analytics.
Finally, we use a number of Google products as marketers. It includes Google Tag Manager, Search Console, Google Ads, Data Studio, Google Optimize, and more. All of these products work hand-in-hand with Google Analytics.
Frequently Asked Questions (FAQs) on Google Analytics
We have discussed some of the major frequently asked questions (FAQs) on Google Analytics. Let’s learn:
Que 1: What is the meaning of KPIs in Google Analytics?
A KPI, or key performance indicator, is a quantitative performance indicator that assists website managers in tracking and analyzing website performance against established business objectives. It assists them in putting their marketing objectives into action.
KPIs include the following major examples:
- Pages
- Users
- Pageviews
- Sessions
- Average Time
- Bounce Rate
- Conversion Rate
Que 2: Difference between Visits and Click?
The term "visit" relates to how long someone stays on a website.
On the other hand, Clicks represent an activity taken on a website or on a specific product.
Que 3: How can I check the UA Tracking code?
Universal Analytics is a term that refers to a set of tools that can be used to analyze In the admin part of the web property, you'll find the Universal Analytics tracking code.
Que 4: Can we remove Goals in Google Analytics?
No, we won't be able to remove the goal. By disabling the goal, we can block it from being recorded.
Que 5: Beneficial features of Google Analytics for any website?
Beneficial key features of Google Analytics for the website include:
1. Collects all reports automatically
2. Insight into website traffic in real-time
3. Create reports that are tailored to your needs.
4. Utilized in conjunction with other platforms and tools. It includes Google AdWords and Google products.
5. It is completely free.
6. Insights into the crowd and performance are provided.
7. Easy and Simple installation and navigation.
8. Capacity to produce and monitor performance goals.
Que 6: How does Google Analytics for marketing helps small businesses?
Google Analytics provides a wealth of information. It includes business goals, bounce rate, successful search phrases, and traffic sources. Furthermore, this allows small businesses to boost their marketing ROI by optimizing their digital media marketing operations.
Que 7: Google Analytics: Metrics and Dimensions
Let’s understand these two concepts of Google Analytics:
Metrics
It covers qualitative calculations. The statistics you'll see on the platform are the result of metrics. Anything that can be measured with a number is called a metric.
Consider the number of visitors, the number of transactions, the value of conversions, the average time spent on the site, and so on.
Dimensions
It is a process of classifying metrics. These are the most basic characteristics of the information gathered. For example, 'Location' is a dimension that can be offered for user data. It showcases from where your user visited your website.
Google Analytics generates a number of standard reports. We'll go through several of these in detail later. Furthermore, customized reports with several dimensions and metrics are also possible.
It is not possible to incorporate all dimensions and metrics into reports. They each have a scope,' which refers to the level at which their data is collected.
Furthermore, 'User-level, 'session-level,' and 'hit-level' are the three separate scopes. It's only possible to combine dimensions and metrics from the same scope.
How Deskera Can Assist You?
Looking for conventional yet innovative CRM solutions for your brand or business?
Then, Deskera CRM is a perfect choice for you. It offers a powerful and easy-to-use platform that automates sales, marketing, and support.
Close successful deals with seamless and core features including email campaigns, customer support, sales pipeline, deal management, and much more. Get comprehensive analytics on click-through rates (CTR) and open rates without any hassle.
Sign up today for a free trial today and discover the amazing features of Deskera CRM!
Final Takeaways
Kudos to you for making it to the end of this detailed guide. Before you start implementing Google Analytics, let’s revise some of the crucial points for your future reference:
- Google Analytics is a free analytics platform that tracks, collects, and reports data based on how visitors interact with your website
- Segments assist you in separating and understanding subsets of data in order to study business patterns.
- The best features of Google Analytics include the real-time audience, campaign tracking functionalities, goal setting, and acquisition & behavior reporting.
- Google Analytics is a program that offers a wealth of information. It might help you increase the ROI you see from your SEO efforts if you can access and evaluate the right reports.
- You can also add new traffic sources, such as email, to improve the accuracy of the acquisition data.
- Depending on your campaign's needs, you can change the time period to daily, weekly, bimonthly, or monthly.
- Google Analytics allows you to conduct a higher-level examination of your site's effectiveness. You also have the option of doing a more in-depth investigation.
Related Articles