
Order management has become one of the most critical functions for businesses striving to deliver speed, accuracy, and superior customer experiences. As global supply chains grow more interconnected, the pressure to fulfill orders faster and more efficiently continues to rise. This shift has accelerated the adoption of digital order management tools, propelling the global order management market to an estimated value of $3.2 billion in 2023, with projections indicating it may reach $6.1 billion by 2032, growing at a CAGR of 7.4%. This rapid expansion highlights how essential structured, data-driven order management has become for modern enterprises.
At the heart of this transformation are KPIs—precise performance indicators that allow businesses to monitor every step of the order lifecycle. From order accuracy and cycle time to fulfillment speed and return rates, these metrics help companies identify bottlenecks, uncover inefficiencies, and improve operational reliability. When tracked consistently, order management KPIs provide the clarity needed to streamline processes, reduce errors, and ensure that customers receive the right products at the right time.
However, tracking KPIs is no longer just a performance exercise—it has evolved into a strategic necessity. With rising customer expectations, competitive pressures, and complex supply networks, businesses need real-time visibility into their operations to adapt quickly. KPIs empower organizations to benchmark their performance, anticipate challenges, and make informed decisions that enhance profitability and long-term resilience.
This is where modern platforms like Deskera ERP make a substantial difference. Deskera unifies sales, inventory, order processing, procurement, and fulfillment into a single integrated system, allowing businesses to track their KPIs in real time. Its automated workflows, mobile accessibility, and AI-driven insights help companies eliminate manual work, reduce delays, and maintain full visibility across the order lifecycle. With Deskera’s intuitive dashboards and actionable analytics, businesses can monitor key order management KPIs effortlessly and continuously improve their operational performance.
What Is Order Management?
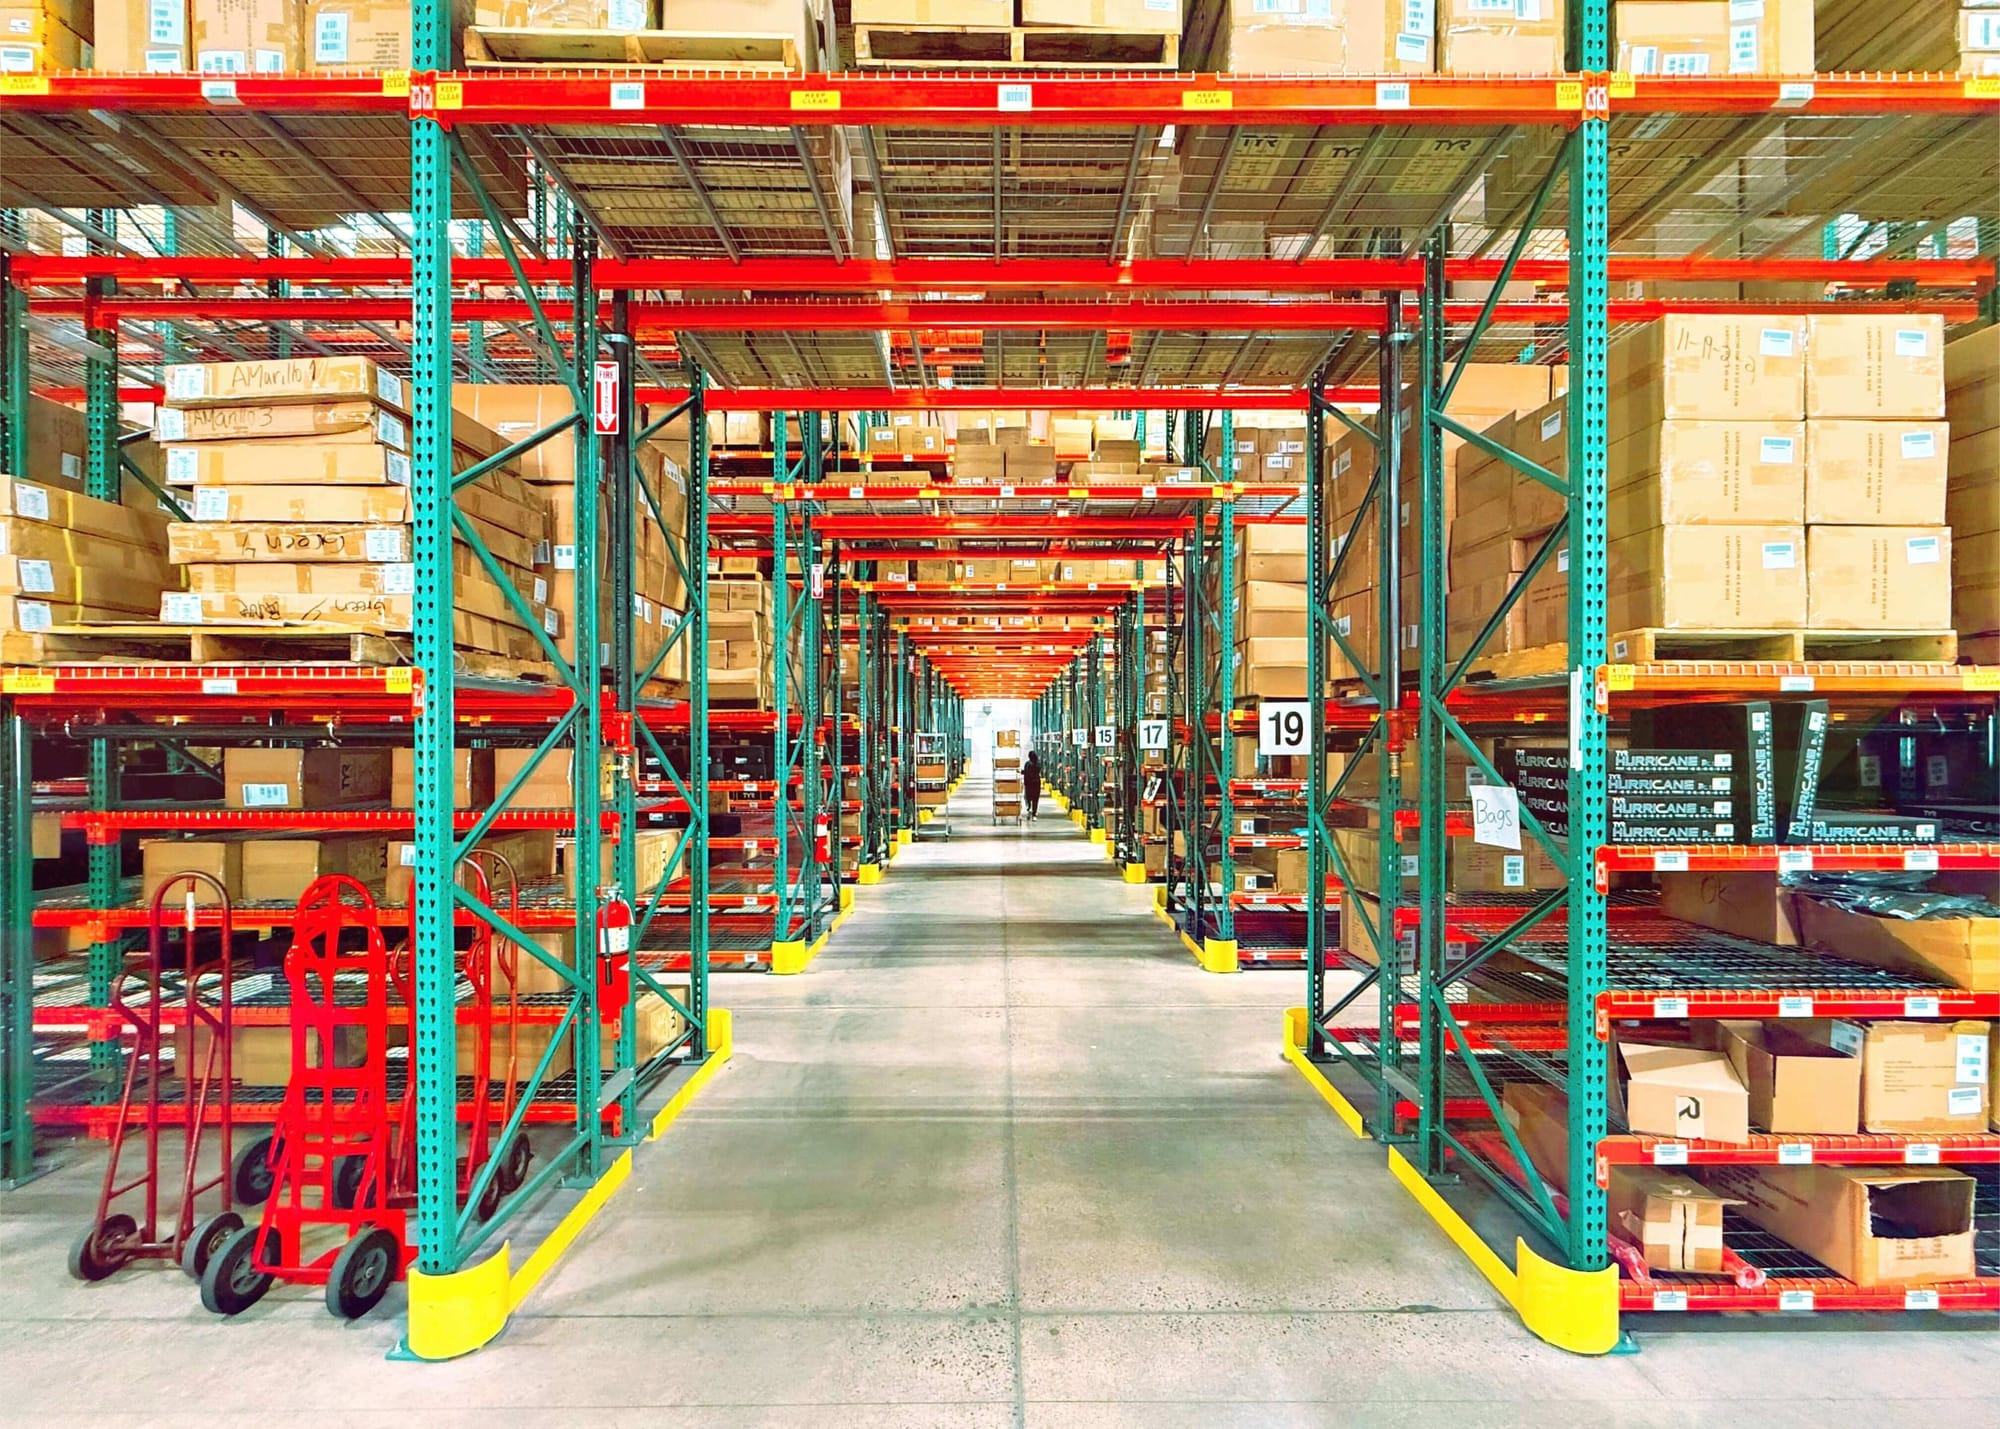
Order management is the end-to-end process of capturing, processing, tracking, and fulfilling customer orders across the entire order lifecycle. It begins the moment a customer places an order and continues through order verification, inventory allocation, picking, packing, shipping, delivery, and even post-purchase activities such as returns, exchanges, or warranty-related repairs. In other words, order management encompasses every step required to get a product into the customer’s hands accurately, efficiently, and on time.
At its core, order management involves a coordinated flow of information between multiple functions—sales, inventory, warehouse operations, logistics, customer service, and finance. The process ensures that the right products are available, orders are fulfilled correctly, and customers receive timely updates on their purchases. This alignment helps businesses reduce errors, avoid delays, and maintain a seamless customer experience throughout the entire journey.
Effective order management also relies on robust systems and tools that automate workflows, centralize data, and provide real-time visibility into inventory and fulfillment status. From IT systems that process orders to warehouse and shipping platforms, every component plays a vital role in ensuring fast, accurate deliveries. With efficient order management, businesses can streamline operations, reduce operational costs, minimize stockouts and backorders, and ultimately strengthen customer satisfaction and loyalty.
What Are Order Management KPIs?
Order management KPIs (Key Performance Indicators) are measurable metrics used to evaluate how efficiently and accurately a business processes, fulfills, and delivers customer orders. These KPIs cover every stage of the order lifecycle—from the moment a customer places an order to the final delivery and any post-purchase activities such as returns or exchanges. By tracking these indicators, companies can determine how well their internal processes are working to meet customer expectations and identify where improvements are needed.
Well-designed order management KPIs are built on clear, objective, and actionable data. They help operations teams pinpoint inefficiencies, measure productivity, and uncover gaps in workflows—whether it’s slow order processing, inaccurate picking, stockouts, or late deliveries. With these insights, businesses can make data-driven decisions to streamline processes, reduce errors, enhance fulfillment speed, and ultimately strengthen the overall customer experience.
These KPIs play a strategic role in helping businesses compare current performance against historical data, industry benchmarks, and competitors. They also offer valuable insights into customer behavior and service quality. For example, with 94% of consumers blaming retailers for poor delivery experiences and one in five online purchases being returned, monitoring these metrics becomes essential for building trust, maintaining loyalty, and staying competitive in a crowded market.
Companies can track order management KPIs manually using spreadsheets, but most modern businesses rely on order management systems (OMS) or integrated ERP platforms to automate data collection and reporting. By consistently measuring these KPIs, organizations gain real-time visibility across sourcing, warehouse operations, logistics, shipping, and returns—empowering them to optimize every stage of the fulfillment process and deliver superior outcomes that directly impact profitability and customer satisfaction.
Importance of Tracking Order Management KPIs
Tracking order management KPIs is essential because the order stage represents a pivotal moment in the customer journey—the point where interest becomes revenue. Even the strongest marketing, branding, and sales efforts can be undone if customers face delays, errors, or poor delivery experiences.
A single unsatisfactory order experience can lead to returns, negative reviews, or the loss of a repeat customer. That’s why businesses closely monitor order management KPIs to understand how efficiently they process, fulfill, and deliver orders.
By analyzing these metrics, companies gain more than operational insights—they uncover strategic opportunities. KPIs help reveal hidden bottlenecks, cost leaks, unprofitable product lines, and inefficiencies across fulfillment workflows. For example, a business might discover that shipping small quantities of low-margin products is costing them more than they earn, prompting them to set minimum order sizes. In essence, KPIs shine a spotlight on what’s working, what’s not, and where improvements can directly enhance profitability and customer satisfaction.
Below are the core reasons why tracking order management KPIs is indispensable for business performance:
1. Data-Driven Decision-Making
Tracking KPIs allows businesses to make informed decisions rather than relying on assumptions or intuition. By monitoring objective, real-time performance data across order processing, warehouse operations, and delivery, companies can detect inefficiencies, assess trends, and make targeted improvements. This leads to smarter strategies, optimized resource allocation, and continuous process refinement.
2. Improved Cash Flow and Cost Efficiency
Order management KPIs highlight inefficiencies that drain financial resources, such as slow picking times, incorrect shipments, or high return rates.
By identifying where money is being lost, businesses can streamline workflows, reduce waste, minimize avoidable shipping costs, and free up cash flow.
In many cases, these insights lead to decisions that significantly improve profitability—such as adjusting product bundles or optimizing dispatch processes.
3. Optimized Sales and Product Strategy
Insights from KPIs reveal which products sell well, which SKUs have shrinking margins, and which order patterns create operational challenges. These metrics help businesses optimize pricing, plan promotions, and refine inventory strategies.
Companies may even uncover opportunities—like selling bulk quantities at lower prices to increase profit through reduced shipping and processing costs.
4. Enhanced Customer Satisfaction and Retention
Order management KPIs help prevent issues that frustrate customers, such as delays, incorrect items, or poor communication. By monitoring fulfillment speed, accuracy, and delivery performance, businesses can proactively resolve problems and enhance the overall buying experience. When done right, customers return more often, leave positive reviews, and act as brand advocates—giving companies a competitive edge.
5. Ability to Identify and Fix Operational Bottlenecks
KPIs provide granular visibility across every step of the order journey—from inventory availability to picking accuracy to final delivery. This enables managers to detect hidden bottlenecks, such as slow packing times or inaccurate stock records, and address them before they escalate. Ultimately, this leads to smoother workflows and a more predictable, reliable order process.
6. Continuous Improvement and Process Automation
Regularly tracking KPIs helps businesses determine which tasks to automate, optimize, or restructure. Companies can start with simple dashboards or spreadsheets and later upgrade to advanced analytics tools or ERP systems. These insights guide the shift from manual, error-prone processes to streamlined, automated operations that scale with business growth.
7. Strengthens Cross-Department Coordination
Order management KPIs bring clarity across departments such as sales, warehouse operations, procurement, logistics, and customer service. With everyone aligned to the same metrics, teams work cohesively rather than in silos. This shared visibility helps reduce miscommunication, speed up issue resolution, and create a unified, customer-centric workflow across the organization.
8. Improves Forecasting and Demand Planning
Accurate KPI tracking provides historical and real-time data that businesses can use to forecast demand, plan inventory purchases, and anticipate peak order periods. Metrics like order volume trends, return rates, and seasonal fluctuations enable better planning, reducing stockouts, overstocks, and unnecessary warehousing costs. This translates into more efficient operations and stronger financial performance.
9. Enhances Operational Transparency and Accountability
KPIs make performance measurable and visible, enabling managers to set clear expectations and hold teams accountable. When performance benchmarks are defined and tracked, employees understand their goals, managers detect issues faster, and continuous improvement becomes a measurable part of the culture. This transparency helps elevate the entire organization’s performance standards.
10. Helps Reduce Order Errors and Returns
By monitoring metrics like order accuracy, pick-and-pack accuracy, and return reasons, businesses can uncover patterns that lead to preventable mistakes. Addressing these errors reduces return rates, saves costs associated with reverse logistics, and improves the customer experience. Each reduction in errors brings measurable improvements in efficiency and profitability.
11. Supports Scalability and Business Growth
As order volumes increase, manual oversight becomes impossible. KPIs help businesses scale by providing consistent, automated insights into performance, efficiency, and resource utilization. Whether expanding into new markets, adding products, or increasing order volume, KPIs ensure that operational quality doesn’t decline as the business grows.
12. Helps Benchmark Against Industry Standards
Tracking order management KPIs allows businesses to compare their performance against industry averages and competitor benchmarks. This helps identify areas where the business is excelling or falling behind, guiding targeted investments or process improvements. Benchmarking is particularly valuable for industries with tight SLAs and high customer expectations.
13. Enables Proactive Problem-Solving
Rather than reacting after problems arise—such as delayed shipments or stockouts—KPIs help businesses identify early warning signs. Metrics like low inventory levels, rising backorder rates, or slow picking times allow companies to intervene before issues escalate. This proactive approach minimizes disruptions and maintains smooth order flow even during high-demand periods.
14. Elevates Customer Trust and Brand Reputation
Reliable order management leads to accurate deliveries, faster fulfillment, and fewer service issues—all of which contribute to stronger brand trust. By monitoring KPIs, businesses ensure consistency in service quality, which boosts customer loyalty and encourages positive word-of-mouth. In competitive markets, this can be a major differentiator.
20 Order Management KPIs You Should Track
Improving order management begins with tracking the right performance metrics. Order management KPIs help businesses understand how efficiently they process customer orders, manage operational costs, and deliver the right products on time.
Consistently monitoring these indicators allows companies to identify bottlenecks, enhance productivity, and provide a superior end-to-end customer experience.
Below are the essential KPIs categorized across key operational stages.
1. Order Cycle Time
Order cycle time measures how long it takes from the moment a customer places an order until the final delivery. It tracks the overall efficiency of your order processing workflow and highlights delays across picking, packing, shipping, and dispatch. Reducing this time directly enhances customer satisfaction and improves operational performance.
Formula: Order Cycle Time = Order Delivery Date – Order Placement Date
Why It Matters: A shorter order cycle time indicates a faster, more efficient fulfillment process, which boosts customer loyalty and reduces the risk of cancellations. It also helps businesses optimize labor planning, reduce bottlenecks, and stay competitive in markets where speed is a key differentiator.
2. Order Accuracy Rate
Order accuracy rate measures how many orders are delivered to customers correctly—without errors in items, quantities, or specifications. It is one of the most critical KPIs because mistakes directly impact customer satisfaction, return volumes, and service costs. High accuracy reflects disciplined processes and well-managed warehouse operations.
Formula: Order Accuracy Rate = (Accurate Orders ÷ Total Orders) × 100
Why It Matters: Higher accuracy means fewer returns, lower re-delivery costs, and improved brand trust. Accurate orders also reduce support tickets and operational disruptions, enabling teams to focus on strategic improvements rather than corrective work.
3. Perfect Order Rate
The perfect order rate evaluates how many orders are completed flawlessly — delivered on time, in full, damage-free, and with complete, error-free documentation. It’s a comprehensive KPI that captures the overall efficiency and reliability of your fulfillment operations from end to end.
Formula: Perfect Order Rate = (Number of Perfect Orders ÷ Total Orders) × 100
Why It Matters: This KPI is often used as a benchmark for customer experience excellence. A high perfect order rate leads to stronger loyalty, improved reviews, and lower operating costs resulting from fewer errors, delays, and damages.
4. Rate of Return
The rate of return shows how many orders customers send back due to issues like defects, incorrect items, poor packaging, or dissatisfaction. Monitoring return rate helps identify quality problems, supply chain gaps, or product-related issues affecting customer trust and profitability.
Formula: Rate of Return = (Number of Returned Orders ÷ Total Delivered Orders) × 100
Why It Matters: A high return rate increases logistics costs, impacts cash flow, and weakens customer perception. Tracking and reducing this metric helps businesses minimize losses, enhance product quality, and optimize customer satisfaction.
5. Fill Rate
Fill rate measures the percentage of customer orders fulfilled immediately from available stock without backorders or delays. It reflects how well your inventory planning aligns with customer demand and ensures smooth order fulfillment.
Formula: Fill Rate = (Number of Orders Fulfilled from Stock ÷ Total Customer Orders) × 100
Why It Matters: A high fill rate indicates strong inventory management, fewer lost sales, and improved customer experience. It supports better demand forecasting and helps businesses maintain a competitive advantage by ensuring product availability at the right time.
6. Order Fulfillment Rate
The order fulfillment rate shows the percentage of customer orders successfully processed and shipped without delays or stockouts. It indicates how well your operations, inventory, and warehouse systems work together to meet customer demand consistently and without disruption.
Formula: Order Fulfillment Rate = (Orders Fulfilled ÷ Total Orders Received) × 100
Why It Matters: A high fulfillment rate demonstrates strong operational efficiency, reduces customer frustration, and improves brand reliability. It also signals effective stock planning and warehouse accuracy.
7. Backorder Rate
The backorder rate measures the percentage of orders that cannot be fulfilled immediately due to insufficient stock. It helps businesses understand how often inventory shortages interrupt the order management cycle.
Formula: Backorder Rate = (Number of Backordered Items ÷ Total Items Ordered) × 100
Why It Matters: Lower backorder rates mean fewer lost sales, better forecasting, and improved customer satisfaction. High rates signal poor inventory planning or supply chain issues.
8. Order Pick Accuracy
This KPI tracks how accurately items are picked from the warehouse before packing. It identifies errors made during the picking stage, which often lead to incorrect shipments.
Formula: Pick Accuracy = (Correctly Picked Orders ÷ Total Orders Picked) × 100
Why It Matters: High pick accuracy reduces downstream errors, minimizes returns, and enhances overall fulfillment reliability. It ensures customers receive exactly what they ordered.
9. Order Processing Time
Order processing time refers to the duration required to verify, confirm, and initiate fulfillment after receiving a customer order. It includes validation, invoicing, allocation, and routing steps.
Formula: Order Processing Time = Order Confirmation Time – Order Placement Time
Why It Matters: Shorter processing times allow faster fulfillment, prevent delays, and help maintain operational flow, especially during peak seasons.
10. On-Time Delivery Rate
This KPI measures how often orders are delivered within the promised timeframe. It reflects the efficiency of logistics operations, courier performance, and internal coordination.
Formula: On-Time Delivery Rate = (On-Time Deliveries ÷ Total Deliveries) × 100
Why It Matters: Consistent on-time delivery improves customer satisfaction, strengthens trust, and minimizes escalations and refund claims.
11. Inventory Turnover
Inventory turnover shows how often stock is sold and replaced within a specific period. It indicates the speed and efficiency of inventory movement.
Formula: Inventory Turnover = Cost of Goods Sold ÷ Average Inventory
Why It Matters: A high turnover rate means efficient inventory use, lower holding costs, and reduced risk of overstocking or obsolescence.
12. Cost per Order
This KPI calculates the total cost incurred to process and fulfill each customer order. It includes labor, warehousing, packaging, transportation, and administrative expenses.
Formula: Cost per Order = Total Fulfillment Costs ÷ Number of Orders Processed
Why It Matters: Understanding this cost helps businesses optimize operations, improve profitability, and identify unnecessary expenses.
13. Return Processing Time
Return processing time measures how long it takes for a business to receive, inspect, and resolve a returned order. It impacts customer perception and refund cycles.
Formula: Return Processing Time = Return Resolution Date – Return Initiation Date
Why It Matters: Shorter processing time improves customer satisfaction and accelerates inventory reintegration.
14. Order-to-Cash Cycle Time
This KPI measures the time between receiving an order and collecting payment. It reflects how fast a business converts orders into cash flow.
Formula: Order-to-Cash Cycle Time = Payment Receipt Date – Order Placement Date
Why It Matters: A shorter cycle strengthens liquidity, reduces financial risk, and improves working capital.
15. Stockout Rate
The stockout rate indicates how often inventory levels run out when customers place orders. It highlights poor demand forecasting or replenishment delays.
Formula: Stockout Rate = (Stockout Events ÷ Total SKUs or Orders) × 100
Why It Matters: Minimizing stockouts helps retain customers, prevent lost sales, and maintain service continuity.
16. Perfect Delivery Index
This KPI measures how many orders reach customers in perfect condition — no damage, no delays, and no documentation errors.
Formula: Perfect Delivery Index = (Perfect Deliveries ÷ Total Deliveries) × 100
Why It Matters: It reflects the combined efficiency of packing, logistics, and last-mile delivery.
17. Average Order Value (AOV)
AOV measures the average value of each customer order. It provides insight into customer buying behavior and helps forecast revenue.
Formula: AOV = Total Revenue ÷ Total Orders
Why It Matters: Tracking AOV helps businesses improve upselling, bundling, and promotional strategies.
18. Order Lead Time
Order lead time is the time between receiving an order and delivering the final product. It includes processing, picking, packing, and shipping.
Formula: Order Lead Time = Delivery Date – Order Date
Why It Matters: Shorter lead times boost customer satisfaction and reduce abandonment rates.
19. Warehouse Capacity Utilization
This KPI measures the percentage of warehouse space being effectively used for storage and operations.
Formula: Warehouse Utilization = (Used Storage Space ÷ Total Storage Capacity) × 100
Why It Matters: Higher utilization reduces expansion costs and improves inventory organization.
20. Order Cancellation Rate
This KPI tracks how many customer orders are cancelled before fulfillment. It helps identify issues in stock availability, pricing errors, and miscommunication.
Formula: Order Cancellation Rate = (Cancelled Orders ÷ Total Orders) × 100
Why It Matters: Lower cancellation rates improve revenue stability and customer trust.
21. Customer Order Frequency
This measures how often customers place orders within a specific time period. It highlights customer engagement and loyalty trends.
Formula: Order Frequency = Total Orders ÷ Number of Active Customers
Why It Matters: Higher frequency signals stronger retention and customer satisfaction.
How to Select the Right KPIs for Your Order Management Process
Choosing the right KPIs for order management isn’t about tracking everything—it’s about tracking what truly moves the needle for your business. The right metrics help you understand performance, uncover inefficiencies, improve customer satisfaction, and support data-driven decision-making.
Here’s a structured approach to selecting the most relevant KPIs for your order management process.
1. Start by Defining Your Business Goals
Before choosing KPIs, understand what you want to improve: faster deliveries, fewer returns, lower costs, or higher order accuracy. Your KPIs should directly align with these goals.
Example: If your goal is faster turnaround, metrics like Order Cycle Time and Order Processing Time become essential.
2. Understand Your Order Management Workflow
Break your entire order journey into stages: order placement → processing → picking → packing → dispatch → delivery → returns. Identify where delays, errors, or bottlenecks commonly occur.
Why this matters: Selecting KPIs without understanding your workflow often leads to irrelevant tracking and misleading insights.
3. Choose KPIs That Are Actionable, Not Just Informational
A useful KPI should help you improve something—not just observe it.
Good KPI: Order Accuracy Rate (You can improve accuracy through training, barcode scanning, etc.)
Weak KPI: Number of Orders Per Day (Useful for reporting but not for performance improvement.)
4. Focus on Customer-Impact Metrics
Order management is tightly connected to customer satisfaction. Track KPIs that reflect your customers’ experience.
Examples include:
- On-Time Delivery Rate
- Perfect Order Rate
- Return Rate
These metrics directly influence repeat purchases and brand loyalty.
5. Balance Efficiency Metrics with Cost Metrics
Operational speed is important, but so are cost efficiencies. Choose KPIs that give you a balanced view of performance.
Examples:
- Efficiency KPIs: Order Lead Time, Order Processing Time
- Cost KPIs: Cost per Order, Shipping Cost Ratio
A balanced KPI set prevents you from improving one area at the expense of another.
6. Ensure Your KPIs Are Measurable with Your Current Systems
Your current ERP, WMS, or OMS should be able to track the KPIs you choose. If a metric requires data you don’t currently capture, consider whether it’s worth upgrading systems or simplifying your KPI list.
Tip: Most businesses start with 5–10 core KPIs before expanding.
7. Prioritize KPIs That Reveal Bottlenecks
Look for KPIs that expose delays, inefficiencies, or unnecessary resource consumption.
Examples include:
- Backorder Rate
- Order Cycle Time
- Picking Accuracy
These KPIs help you identify operational weak points early.
8. Keep KPIs Relevant to Your Industry and Order Volume
Different businesses need different KPIs.
For eCommerce: On-Time Delivery, Return Rate, Perfect Order Index
For B2B distributors: Fill Rate, Lead Time, Inventory Turnover
For manufacturers: Order Fulfillment Cycle Time, Forecast Accuracy
Choose KPIs that match your operational realities.
9. Make KPIs Timely and Easily Reviewable
Your KPIs should provide value quickly. Choose metrics you can track daily, weekly, or monthly—not annually.
Why this matters: Frequent visibility supports faster decision-making and continuous improvement.
10. Review and Adjust KPIs Regularly
As your business grows, markets evolve, and order volumes expand, your KPIs must evolve too.
Example: A startup may not track Cost per Order initially, but it becomes essential once order volumes rise.
Common Challenges Businesses Face When Tracking Order Management KPIs
Tracking order management KPIs is essential for understanding performance, improving customer satisfaction, and optimizing operations.
However, many businesses struggle to measure these metrics accurately or consistently. These challenges often lead to incomplete insights, misaligned decisions, and missed opportunities for growth.
Below are the most common obstacles companies face when tracking order management KPIs—and why they matter.
1. Lack of Real-Time Data Visibility
Many businesses rely on outdated systems or manual processes, resulting in delayed or incomplete data. Without real-time updates on orders, inventory, shipping, or returns, KPIs become inaccurate and reactive rather than proactive. This lack of visibility prevents quick decision-making and increases the risk of stockouts, late deliveries, or operational bottlenecks.
2. Data Silos Across Departments
Order management requires coordination between sales, inventory, warehouse operations, procurement, logistics, and customer service. When these departments use separate tools or disconnected systems, data becomes fragmented and inconsistent. This makes it difficult to calculate KPIs accurately, as different teams may have conflicting information about order status or inventory levels.
3. Overreliance on Manual Tracking
Many businesses still use spreadsheets or manual logs to track KPIs. While this may work initially, it becomes error-prone and unsustainable as order volumes grow. Manual tracking slows down reporting, introduces data entry mistakes, and prevents businesses from scaling their KPI measurement efficiently.
4. Tracking Too Many KPIs at Once
Some companies try to measure every possible metric, resulting in information overload. Instead of improving clarity, too many KPIs create confusion and dilute focus. Teams struggle to prioritize which metrics truly impact customer satisfaction, cost control, or fulfillment efficiency.
5. Poorly Defined or Inconsistent KPI Definitions
KPIs must be based on standardized formulas and clear definitions. Issues arise when teams interpret KPIs differently—for example, calculating “Order Processing Time” differently in different departments. Inconsistent definitions make KPI comparisons meaningless and lead to inaccurate trend analysis.
6. Incomplete or Low-Quality Data
If orders, returns, shipments, or stock movements are not recorded correctly, KPI values become unreliable. Missing timestamps, incorrect product codes, and mismatched order IDs are common sources of inaccurate reporting. Poor data quality limits the effectiveness of analytics and leads to flawed decisions.
7. Difficulty Linking KPIs to Business Goals
Some businesses track KPIs because competitors do or because they seem useful—without linking them to specific goals. When KPIs aren’t aligned with business priorities, they provide little strategic value and often go unused during decision-making.
8. Inability to Act on Insights
Even when businesses successfully track KPIs, they may lack the tools, processes, or culture needed to act on the insights. For example, identifying a high picking error rate is useful only if the business also has the capacity to improve training, update workflows, or invest in automation.
9. Lack of Automation in Reporting
Without automated dashboards or integrated ERP/OMS systems, generating KPI reports becomes tedious and time-consuming. This slows down performance reviews and prevents teams from identifying issues early—especially in fast-moving order environments.
10. Resistance to Change From Teams
Implementing KPI tracking often requires new processes, new tools, and new levels of transparency. Some employees may resist this change due to fear of being evaluated or concerns over additional work. Lack of adoption makes KPI programs ineffective, even if the metrics themselves are well-designed.
11. Fluctuating Order Volumes and Seasonality
Seasonal spikes, promotional events, or unexpected demand surges can cause KPI values to fluctuate drastically. Businesses often struggle to interpret whether changes in KPIs are operational issues or simply seasonal patterns. Without baseline benchmarks, trend analysis becomes unreliable.
12. No Unified System for End-to-End Tracking
Order management spans multiple touchpoints—inventory, warehouse picking, shipping, delivery, and returns. When these are not connected through a unified system, businesses cannot build a consolidated, accurate view of order performance. This makes KPI tracking fragmented and limits the ability to identify root causes.
How Deskera ERP Helps Businesses Track and Improve Order Management KPIs
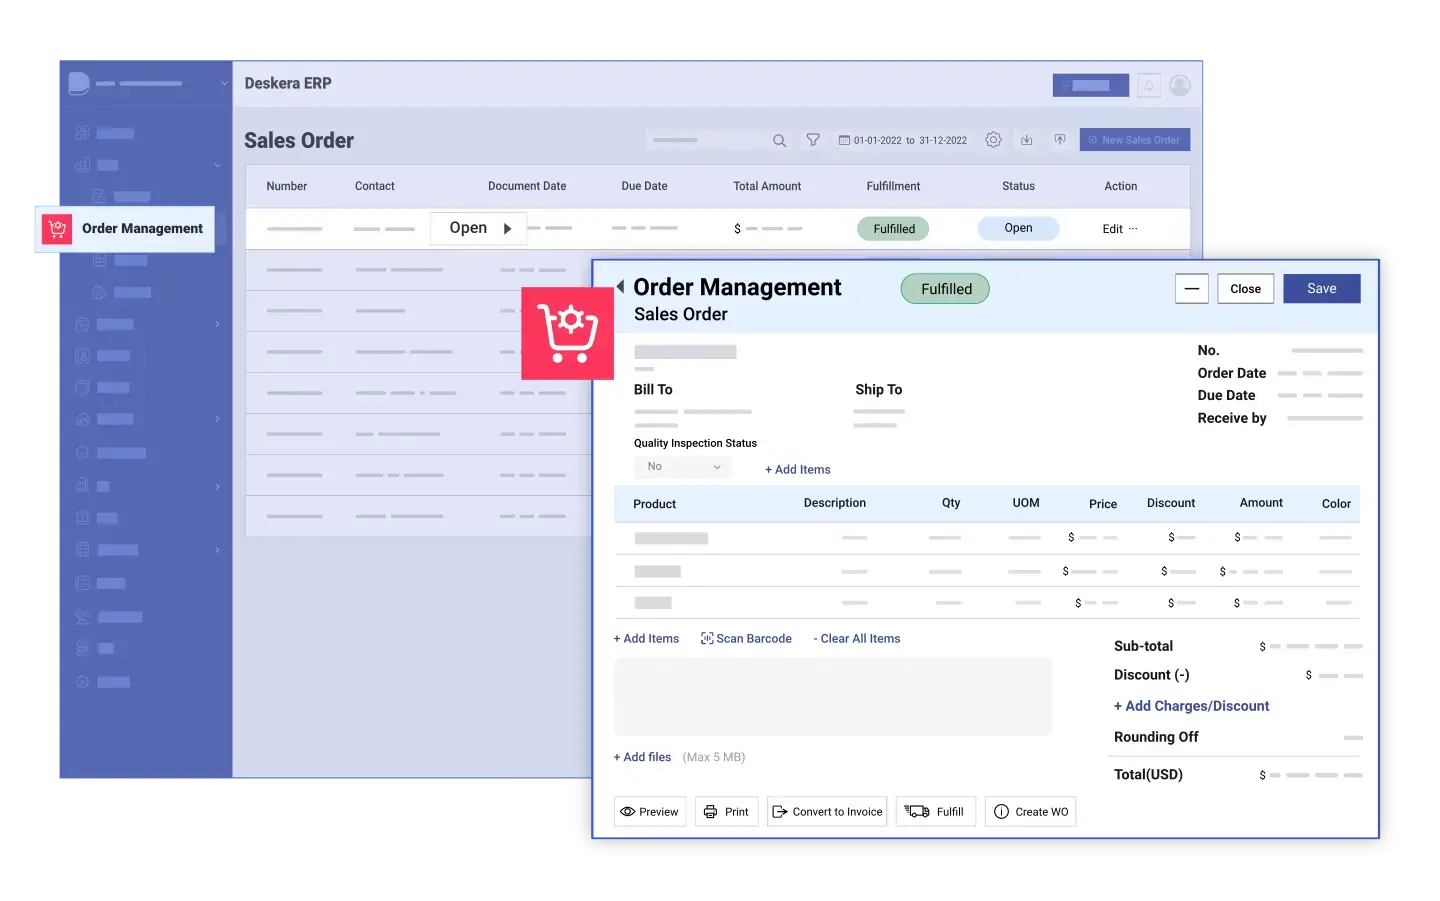
Deskera ERP enables businesses to efficiently track, analyze, and improve every stage of their order management process. By centralizing multi-channel sales, inventory, fulfillment, and shipping into one smart system, Deskera ensures end-to-end visibility—making KPI tracking accurate, automated, and insight-driven. With real-time data, intelligent automation, and seamless workflows, businesses can enhance operational performance and consistently deliver superior customer experiences.
1. Centralized Multi-Channel Order Management
Deskera consolidates orders from all sales channels—online stores, marketplaces, retail, and offline orders—into one unified dashboard. This eliminates data fragmentation and makes it easier to track KPIs like order volume by channel, conversion rates, and average order value. With a single source of truth, businesses can maintain consistency and improve decision-making across teams.
2. Stock Reservation & Backorder Visibility
With built-in stock reservation features, Deskera prevents overselling by automatically allocating available inventory to active orders. The system also provides complete visibility into backorders, helping businesses monitor and reduce their backorder rate. By ensuring accurate stock availability, companies can manage customer expectations more effectively and maintain high fulfillment reliability.
3. Automated Pick-Pack-Ship Workflows
Deskera streamlines fulfillment using its automated Pick-Pack-Ship process. The system generates picking lists, packing slips, and shipping documents without manual intervention. This reduces human error, accelerates order processing time, and improves KPIs such as picking accuracy, fulfillment cycle time, and perfect order rate. The result is a smoother, faster, and more accurate order fulfillment flow.
4. Real-Time Shipment Tracking
Deskera provides real-time visibility into shipment statuses once orders leave the warehouse. Businesses can track delivery progress, monitor delays, and identify exceptions immediately. This directly supports KPIs like on-time delivery rate and OTIF (On-Time In-Full), helping companies ensure a consistent and predictable delivery experience for customers.
5. Automated Returns and Refunds Management
Deskera simplifies returns and refunds through automated RMA workflows, credit notes, and restocking processes. This helps businesses track return rates, return resolution times, and reasons for returns more effectively. By identifying recurring issues early—whether product defects or fulfillment errors—companies can take corrective action to improve customer satisfaction and reduce reverse logistics costs.
6. Real-Time Inventory Sync for Accurate Fulfillment
Deskera updates stock levels in real time across all warehouses, ensuring accuracy in inventory availability. This directly improves KPIs such as fill rate, stockout rate, and oversell rate. With better visibility into inventory health, companies can forecast demand more accurately, maintain optimal stock levels, and ensure high fulfillment reliability even during peak seasons.
7. Dropshipping Capabilities for Faster Fulfillment
Deskera supports automated dropshipping workflows, allowing orders to be routed directly to suppliers for fulfillment. This helps businesses track supplier-related KPIs such as dropship fulfillment rate, vendor lead times, and delivery accuracy. Dropshipping automation also reduces carrying costs and expands product offerings without increasing warehouse load.
8. Powerful Analytics & KPI Reporting
Deskera offers sophisticated dashboards and reporting tools that track key KPIs across sales, inventory, and fulfillment. Users can analyze trends, compare performance periods, and drill down into root causes. This supports metrics such as order cycle time, cost per order, perfect order rate, and return percentage. With built-in analytics, businesses can identify bottlenecks and optimize their order-to-cash process.
9. Real-Time Alerts & Notifications
Deskera allows businesses to set up automated alerts for events such as low stock, delayed deliveries, or rising backorders. These proactive notifications help teams address issues before they impact critical KPIs. Whether it’s triggering fast replenishment or prioritizing delayed orders, these alerts ensure smoother operations and prevent disruptions.
10. Cloud-Based Scalability for Growth
Deskera’s cloud architecture ensures businesses can scale easily as order volumes, warehouses, SKUs, and sales channels grow. KPI tracking remains accurate and efficient even with increased operational complexity. This scalability ensures that companies can maintain high service levels and fulfillment performance as they expand.
Key Takeaways
- Order management KPIs are essential metrics that help businesses measure, analyze, and improve the efficiency of their end-to-end order lifecycle—from order placement to delivery and returns—backed by an industry growing from $3.2 billion (2023) to a projected $6.1 billion by 2032.
- Order management is the complete process of receiving, processing, fulfilling, and supporting customer orders, involving coordination across inventory, warehouse operations, shipping, returns, and customer service.
- Tracking the right KPIs enhances visibility, optimizes workflow performance, and strengthens customer satisfaction by identifying bottlenecks across fulfillment, shipping, inventory accuracy, and delivery reliability.
- Each KPI—ranging from Order Cycle Time and Perfect Order Rate to Fill Rate, Return Rate, Forecast Accuracy, and Order Picking Accuracy—plays a strategic role in diagnosing operational issues, improving fulfillment efficiency, reducing costs, and maximizing delivery performance.
- Businesses should choose KPIs that align directly with their goals, customer promises, order volume, fulfillment model, and technology capabilities, ensuring they track metrics that truly influence operational success.
- Companies often struggle with data fragmentation, outdated systems, inconsistent tracking methods, poor integration between sales and warehouse tools, and limited real-time visibility into orders, leading to inaccurate or delayed KPI monitoring.
- Deskera ERP streamlines order tracking through end-to-end automation, real-time dashboards, integrated inventory and warehouse management, automated alerts, stronger supplier coordination, demand forecasting, and workflow optimization—helping businesses significantly enhance KPI performance.
Related Articles