

Have you ever wondered how some businesses always seem to make the right decisions at the right time? The answer lies in how effectively they measure, monitor, and analyze their performance. In today’s fast-paced business environment, relying on intuition is no longer enough—success depends on actionable insights derived from accurate data. This is where performance analytics steps in, helping organizations transform raw data into meaningful strategies that drive measurable results.
Performance analytics goes beyond basic reporting. It provides a comprehensive view of how your business is performing across key areas—finance, operations, sales, and human resources—allowing you to identify what’s working and what needs improvement. By turning performance data into insights, businesses can align their goals, optimize processes, and enhance productivity. In short, performance analytics acts as a compass, guiding organizations toward smarter decisions and sustainable growth.
In the age of digital transformation, leveraging advanced tools and integrated systems is essential to unlock the full potential of performance analytics. Modern ERP (Enterprise Resource Planning) solutions make this possible by unifying data across departments and delivering real-time visibility into performance metrics. Rather than juggling multiple disconnected systems, businesses can rely on a single source of truth to analyze trends, forecast outcomes, and take proactive action.
Deskera ERP stands out as an intelligent platform designed to simplify this process. It offers powerful performance dashboards, AI-driven analytics, and automated reporting features that give decision-makers clear visibility into every aspect of their operations. From tracking financial performance to monitoring inventory efficiency and workforce productivity, Deskera ERP helps businesses stay agile, informed, and ahead of the curve. With performance analytics at its core, Deskera empowers organizations to make data-backed decisions that fuel consistent growth and long-term success.
What Are Performance Analytics?
Performance analytics is the systematic process of gathering, evaluating, and presenting data to gain a clear understanding of how a business, organization, or team is performing. It goes beyond mere data collection—its goal is to transform raw information into actionable insights that guide decision-making, optimize processes, and foster continuous improvement. Think of it as a business GPS, helping you double down on strategies that work and pivot where necessary, with precision rather than guesswork.
At its core, performance analytics revolves around monitoring key performance indicators (KPIs). These metrics measure progress against defined objectives, pinpoint areas of strength and weakness, and reveal trends and patterns that might otherwise go unnoticed. By analyzing this data, organizations can make informed decisions, allocate resources effectively, and ensure that every department and initiative is aligned with broader business goals.
Performance analytics is also a tool for fostering accountability and growth. It allows businesses to identify high-performing teams and individuals, recognize their contributions, and implement strategies to replicate their success across the organization. Conversely, when goals are not met, performance analytics helps pinpoint the root causes, enabling corrective actions to bring outcomes back on track.
In today’s competitive environment, performance analytics has become indispensable. Organizations use it not only to measure operational efficiency, customer satisfaction, and financial performance but also to cultivate a culture of data-driven decision-making. In essence, performance analytics is more than a tool—it’s a mindset, a commitment to continuous improvement, and a pathway to sustainable growth and excellence.
Objectives of Performance Analytics
Performance analytics is more than just collecting numbers—it serves as a strategic compass that helps organizations navigate complex business environments. Its primary objectives revolve around turning data into actionable insights that drive better decisions, optimize resources, and enhance overall performance.
1. Informed Decision-Making
One of the key objectives is to provide a clear, data-driven foundation for decisions. By analyzing trends and patterns, organizations can identify what strategies are working and which areas require adjustment, ensuring that every action taken is backed by evidence rather than guesswork.
2. Resource Optimization
Performance analytics helps businesses allocate resources efficiently. Whether it’s budgeting, staffing, or time management, organizations can prioritize initiatives that deliver the highest impact, reducing waste and maximizing return on investment.
3. Identifying Strengths and Weaknesses
By examining performance data, businesses can gain a magnified view of their operations, teams, and individual employees. This enables managers to recognize high-performing areas and identify weaknesses or skill gaps, fostering targeted improvements and supporting career development for employees.
4. Driving Continuous Improvement
Performance analytics encourages a culture of ongoing growth and refinement. By regularly monitoring KPIs and outcomes, organizations can implement incremental improvements, set achievable goals, and track progress over time, ensuring sustained organizational development.
5. Enhancing Accountability and Transparency
Another objective is to establish clear benchmarks and expectations. When performance is measurable and visible, employees and teams are more accountable for their results, promoting transparency and a results-oriented culture.
6. Supporting Strategic Alignment
Finally, performance analytics ensures that daily operations and individual contributions align with broader organizational goals. By connecting metrics to strategic objectives, businesses can maintain focus on long-term success while addressing short-term challenges effectively.
Traditional Performance Review vs Performance Analytics
Organizations have long relied on traditional performance reviews to evaluate employee contributions. While these reviews provide a snapshot of past performance, they often have limitations that can affect accuracy, fairness, and actionable insights.
Performance analytics, on the other hand, leverages real-time data to provide a more comprehensive and dynamic view of performance, driving informed decisions and continuous improvement.
Traditional reviews often emphasize tasks completed or hours logged, with feedback dependent on a manager’s observations or recollections. This approach can inadvertently introduce bias and may overlook individual impact or contributions to organizational goals.
Performance analytics shifts the focus from activity to outcomes and measurable contributions, providing a more objective and equitable framework. By relying on data from multiple sources, it reduces subjectivity while still offering context for performance evaluation. Furthermore, it supports continuous feedback, highlights trends, identifies strengths and weaknesses, and streamlines processes to improve overall organizational efficiency.
In essence, while traditional performance reviews provide a historical perspective, performance analytics equips businesses with a forward-looking, actionable view—helping organizations make strategic adjustments, enhance employee development, and drive sustained success.
Performance Analytics vs Performance Appraisals
In today’s data-driven workplace, organizations are shifting from traditional performance reviews to continuous, evidence-based insights. While both performance analytics and performance appraisals aim to evaluate employee effectiveness, their approaches, frequency, and impact differ significantly. Understanding these differences helps businesses strike the right balance between structured evaluation and real-time performance improvement.
Let’s explore how the two concepts compare and complement each other.
1. Core Definition
- Performance Analytics: A data-driven, ongoing process focused on analyzing employee performance metrics. It helps identify trends, forecast outcomes, and guide strategic decisions through dashboards and KPIs.
- Performance Appraisals: A formal, periodic review—often annual or semi-annual—used to assess individual performance against established goals, typically influencing promotions, bonuses, and development plans.
2. Approach and Frequency
- Performance Analytics: Continuous and proactive, offering real-time visibility into employee performance data for ongoing optimization.
- Performance Appraisals: Conducted periodically, providing retrospective feedback on employee contributions and achievements.
3. Data vs Opinion
- Performance Analytics: Relies on measurable indicators such as task completion rate, project success ratio, and attendance data—ensuring objectivity.
- Performance Appraisals: Often includes subjective feedback based on a manager’s personal judgment and observation, which can lead to bias.
4. Purpose and Outcomes
- Performance Analytics: Designed to drive continuous improvement by identifying performance gaps early and enabling corrective actions.
- Performance Appraisals: Primarily focused on evaluating past performance and making administrative decisions like raises or promotions.
5. Tools and Technology
- Performance Analytics: Leverages ERP systems, HR dashboards, and AI-based insights—like those in Deskera ERP—to analyze data automatically and present actionable insights.
- Performance Appraisals: Uses rating scales, feedback forms, and manual documentation typically managed through HR portals or spreadsheets.
6. Employee Experience
- Performance Analytics: Fosters transparency and continuous feedback loops, empowering employees to track progress and self-improve.
- Performance Appraisals: Usually limited to a one-time discussion where employees receive feedback after the review cycle ends.
7. Focus Area
- Performance Analytics: Encompasses descriptive, diagnostic, predictive, and prescriptive analysis, helping leaders look beyond past performance.
- Performance Appraisals: Concentrates on historical performance and goal achievement over a fixed review period.
8. Example in Practice
- Performance Analytics: A sales leader monitors conversion rates and lead response times in real-time dashboards to identify training needs early.
- Performance Appraisals: During an annual review, the same manager evaluates overall yearly sales and assigns a performance score.
Why Performance Analytics Are Important
In today’s fast-paced business environment, understanding how your organization is performing is no longer optional—it’s essential. Performance analytics provides businesses with actionable insights by collecting, analyzing, and visualizing data across operations, sales, HR, and finance.
These insights empower decision-makers to optimize processes, improve productivity, and drive sustained growth. By leveraging performance analytics, companies can move beyond intuition and make evidence-based decisions that propel their success.
1. Provides a Clear Understanding of Organizational Performance
Performance analytics helps organizations gain a comprehensive view of their operations. By tracking key performance indicators (KPIs) and measuring progress against set goals, businesses can pinpoint areas of strength and identify weaknesses. This clarity allows leaders to allocate resources efficiently, prioritize improvement efforts, and ensure that strategies are aligned with overarching business objectives.
2. Enables Data-Driven Decision-Making
Rather than relying on gut feelings, performance analytics equips businesses with concrete data to make informed choices. Insights into customer behavior, market trends, and operational efficiency allow decision-makers to act with confidence. This reduces errors, increases profitability, and ensures that strategies are responsive to actual performance metrics rather than assumptions.
3. Improves Efficiency and Productivity
By analyzing performance data, businesses can uncover bottlenecks and inefficiencies in their processes. Performance analytics highlights areas where operations can be streamlined, costs reduced, and workflows optimized. The result is improved productivity, faster turnaround times, and better value delivered to customers.
4. Provides a Competitive Advantage
Organizations that actively monitor and analyze performance data can stay ahead of the competition. Performance analytics enables businesses to anticipate trends, respond quickly to changing market conditions, and develop innovative strategies. By continuously optimizing performance, companies can differentiate themselves, maintain market leadership, and achieve sustainable growth.
How Performance Analytics Works
Performance analytics is a strategic process that transforms raw data into actionable insights, enabling businesses to make informed decisions and drive sustained growth. At its core, it involves a series of steps—data collection, analysis, interpretation, and continuous monitoring—that together provide a comprehensive understanding of organizational performance.
1. Data Collection from Multiple Sources
The process begins with gathering data from various sources across the organization. This can include financial records, operational metrics, customer interactions, sales data, and HR information. By aggregating data from multiple touchpoints, businesses ensure that their analysis is holistic and reflective of overall performance.
2. Data Analysis and Visualization
Once collected, the data is analyzed using advanced statistical techniques and visualization tools. This step uncovers patterns, trends, and correlations that might not be apparent at first glance. Interactive dashboards, charts, and graphs help decision-makers quickly interpret complex data, making it easier to track KPIs and monitor progress toward goals.
3. Interpretation and Insight Generation
Analysis alone isn’t enough; the next step is interpreting the results. Analysts and business leaders identify key performance indicators, evaluate areas of excellence, and pinpoint opportunities for improvement. These insights provide clarity on which strategies are working and which need adjustment, enabling targeted decision-making.
4. Continuous Monitoring and Refinement
Performance analytics is not a one-time process—it is ongoing and iterative. Continuous monitoring allows businesses to track performance in real-time, respond to changes quickly, and refine strategies as needed. Feedback mechanisms ensure that the insights are actionable, helping organizations stay agile, optimize operations, and maintain a competitive edge.
In essence, performance analytics turns data into a powerful asset. By systematically collecting, analyzing, and interpreting information, businesses gain the clarity and foresight needed to improve efficiency, enhance customer satisfaction, and achieve long-term success.
Master Performance Analytics in 10 Clear Steps
Implementing performance analytics effectively requires a structured approach. These ten steps guide you from setting objectives to continuous improvement, ensuring that your business maximizes the value of its data.
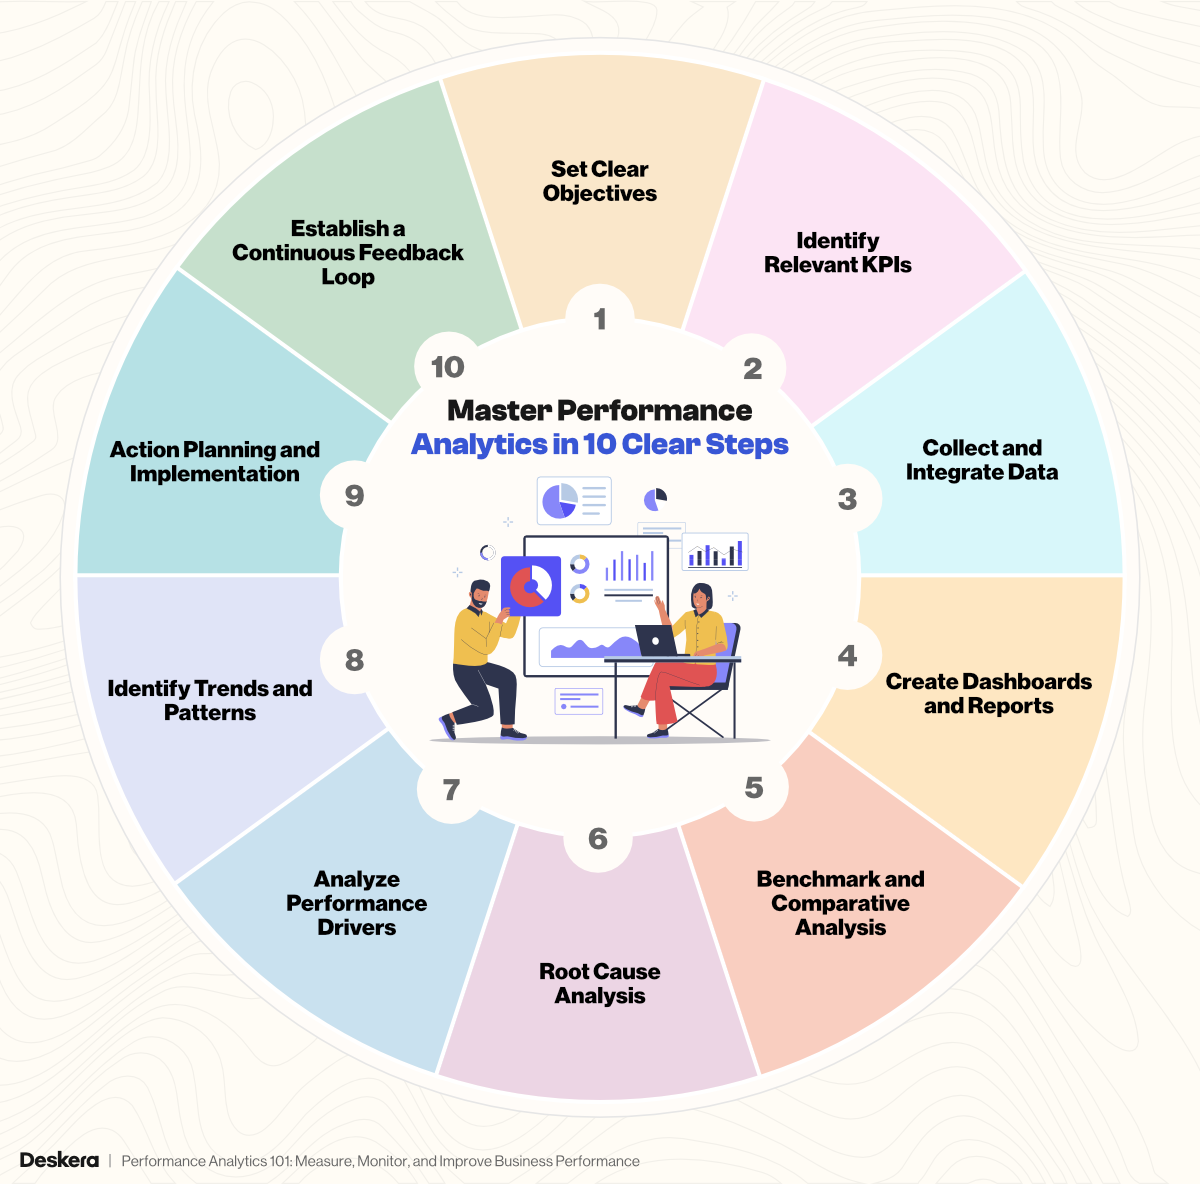
Step 1: Set Clear Objectives
Before diving into data, define what you aim to achieve with performance analytics. Are you looking to improve team collaboration, reduce employee turnover, increase sales, or enhance operational efficiency? Clear, specific goals provide direction and ensure that your analytics efforts are purposeful.
Step 2: Identify Relevant KPIs
Once objectives are set, choose the Key Performance Indicators (KPIs) that reflect progress toward these goals. These could include employee turnover rates, customer satisfaction scores, project delivery timelines, or revenue per employee. Select KPIs that are both measurable and meaningful.
Step 3: Collect and Integrate Data
Gather data from multiple sources, including HR records, performance reviews, employee surveys, and operational reports. Integrate this information to create a complete, accurate picture of performance. The goal is to connect the dots in a way that is consistent, reliable, and human-centered.
Step 4: Create Dashboards and Reports
Visualize your data using intuitive dashboards and reports. This makes trends, progress, and areas needing attention easy to understand at a glance. Share insights openly with leaders and HR teams to align actions and decisions across the organization.
Step 5: Benchmark and Comparative Analysis
Compare your performance metrics against industry standards or competitors. Benchmarking helps identify strengths, weaknesses, and opportunities for improvement, while historical comparisons reveal patterns and trends over time.
Step 6: Root Cause Analysis
Identify the underlying causes of performance issues. Use techniques like the “5 Whys” to dig deeper into problems such as productivity gaps or quality concerns. Document the root causes to inform targeted interventions, such as additional training or workflow adjustments.
Step 7: Analyze Performance Drivers
Examine the data alongside feedback from team members to uncover the factors influencing performance. Understanding these drivers ensures that improvements address the real issues rather than surface-level symptoms.
Step 8: Identify Trends and Patterns
Look for recurring patterns or trends in your performance data. For example, notice if performance dips during specific periods or if certain practices consistently yield better results. Recognizing these trends informs strategic planning and proactive measures.
Step 9: Action Planning and Implementation
Develop clear, actionable plans based on insights from your analysis. Assign responsibilities, set targets, and define deadlines. Monitor progress regularly and adjust plans as needed to ensure continuous improvement.
Step 10: Establish a Continuous Feedback Loop
Encourage ongoing communication and feedback from your team. Regular check-ins, surveys, and discussions help refine strategies, address challenges promptly, and maintain alignment with organizational goals. A continuous feedback loop ensures performance analytics remains dynamic and effective.
Types of Performance Analytics You Can Use in Your Business
Performance analytics is not a one-size-fits-all approach. Depending on your business goals and the insights you need, different types of analytics can help you understand past performance, anticipate future outcomes, and take actionable steps to improve.
Here are the main types of performance analytics that organizations can leverage:
1. Descriptive Analytics
Descriptive analytics focuses on understanding what has happened in the past. By presenting historical data in charts, reports, and dashboards, it helps businesses make sense of previous performance. For example, you can track team productivity, sales performance, or project completion over a set period. Descriptive analytics is the foundation for identifying trends and spotting areas of strength and improvement.
2. Diagnostic Analytics
Diagnostic analytics goes a step further by uncovering the “why” behind performance outcomes. It helps identify the root causes of successes and failures, whether they are due to market shifts, team approaches, or individual performance. Armed with these insights, managers can implement targeted improvements and address challenges at their source.
3. Predictive Analytics
Predictive analytics uses historical data and statistical models to forecast future outcomes. Instead of guessing what might happen, businesses can anticipate potential challenges and opportunities. Examples include estimating project completion times, predicting revenue growth, or identifying employees at risk of attrition. Predictive analytics empowers proactive decision-making.
4. Prescriptive Analytics
Prescriptive analytics acts as a smart guide, recommending specific actions to improve performance. It goes beyond identifying trends or predicting outcomes by suggesting steps such as training initiatives, goal adjustments, or workflow redesigns. This type of analytics combines data insights with actionable recommendations to drive intentional progress.
5. Diagnostic-Predictive-Prescriptive (DPP) Analytics
DPP Analytics integrates the strengths of diagnostic, predictive, and prescriptive analytics into a single framework. It first examines why outcomes occurred, then anticipates what might happen next, and finally recommends how to act. This all-in-one approach is particularly useful for HR and management, placing people at the center of decisions and guiding actions with clarity and empathy.
6. Advanced Analytics
Advanced analytics leverages sophisticated tools such as machine learning, AI, and predictive modeling to provide deeper insights. It helps managers see what truly matters, detect patterns that may not be obvious, and make data-driven decisions with confidence. Advanced analytics transforms complex data into clear, actionable guidance.
7. Real-Time Analytics
Real-time analytics provides live insights into performance as it happens. Like watching a game unfold, managers can monitor KPIs and productivity instantly, tackle issues immediately, and seize emerging opportunities. This type of analytics enables agile decision-making and keeps teams aligned and proactive in achieving business goals.
Benefits of Performance Analytics
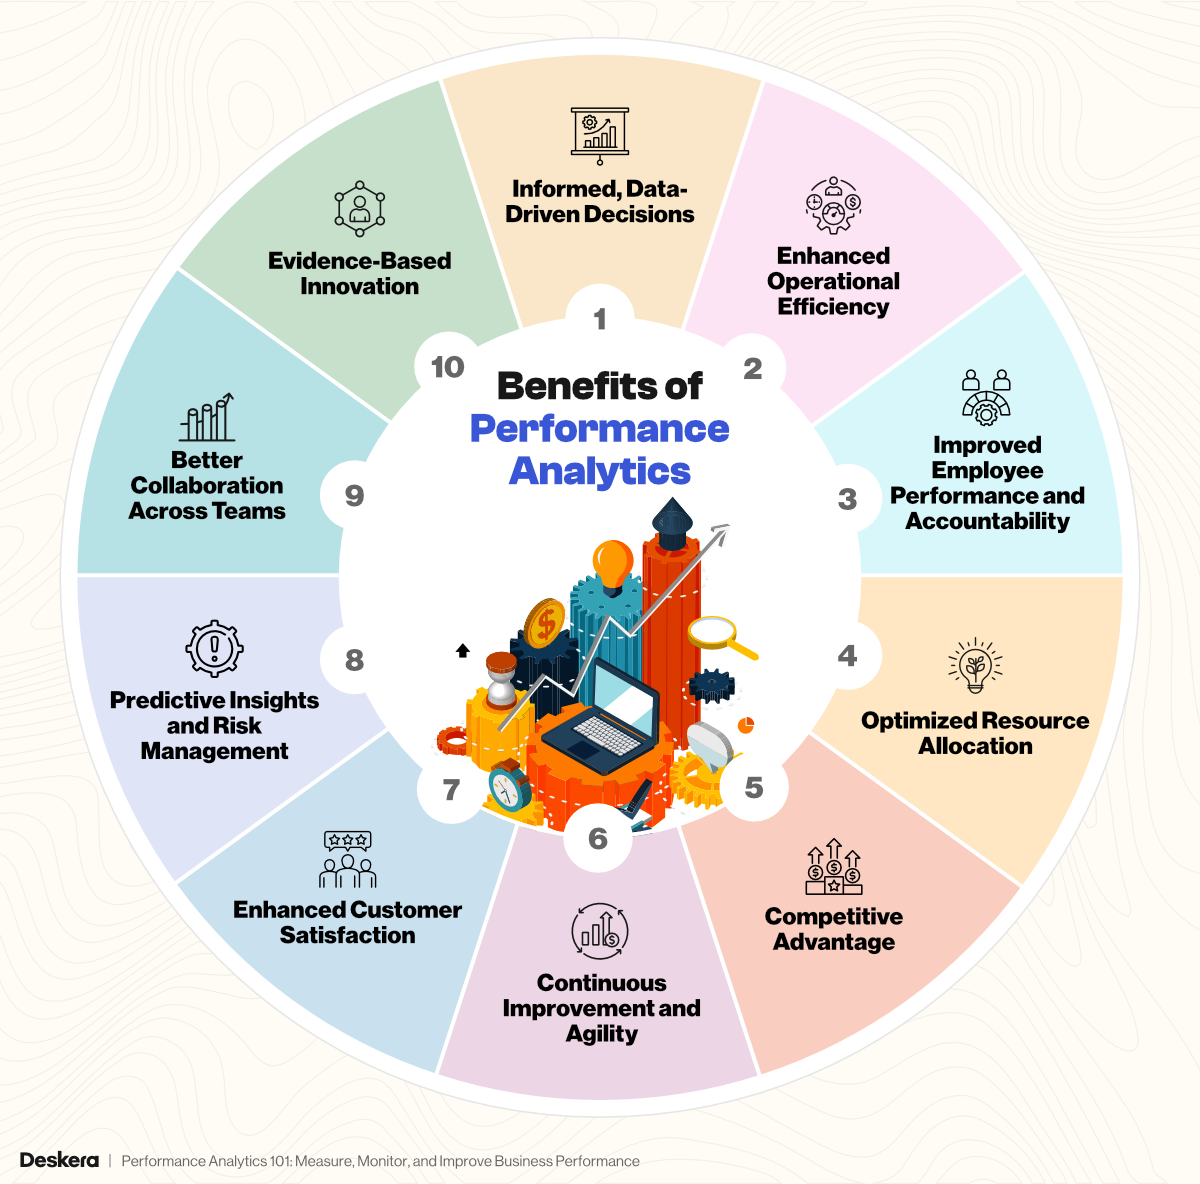
Performance analytics offers businesses a wealth of advantages by turning data into actionable insights. From improving operational efficiency to enabling data-driven decision-making, its benefits extend across all areas of an organization.
Below are the key benefits of implementing performance analytics:
1. Informed, Data-Driven Decisions
By providing insights into trends, patterns, and KPIs, performance analytics allows decision-makers to base their strategies on evidence rather than intuition. This ensures that choices are aligned with organizational goals, reducing errors and maximizing the impact of business initiatives.
2. Enhanced Operational Efficiency
Performance analytics identifies bottlenecks, inefficiencies, and redundant processes within an organization. By highlighting areas for improvement, businesses can streamline workflows, reduce costs, and increase productivity, resulting in smoother operations and better resource allocation.
3. Improved Employee Performance and Accountability
By tracking individual and team KPIs, performance analytics helps organizations recognize high-performing employees, pinpoint skill gaps, and implement targeted training programs. This promotes accountability, motivates employees, and fosters a culture of continuous improvement.
4. Optimized Resource Allocation
With clear visibility into business performance, organizations can allocate resources—time, budget, and personnel—more effectively. This ensures that high-priority initiatives receive the support they need, enhancing overall productivity and return on investment.
5. Competitive Advantage
Businesses that leverage performance analytics can anticipate market trends, respond quickly to customer needs, and innovate proactively. This enables them to stay ahead of competitors, adapt to changing conditions, and develop strategies that differentiate them in the marketplace.
6. Continuous Improvement and Agility
Performance analytics supports ongoing monitoring and evaluation of business activities. Organizations can refine strategies in real-time, adjust to evolving challenges, and implement incremental improvements that lead to sustainable growth and long-term success.
7. Enhanced Customer Satisfaction
By analyzing customer interactions, feedback, and purchasing behavior, businesses can gain a deeper understanding of customer needs and preferences. This allows for tailored experiences, improved service delivery, and stronger customer loyalty.
8. Predictive Insights and Risk Management
Performance analytics enables predictive modeling to forecast trends, anticipate challenges, and mitigate risks before they escalate. Organizations can proactively address potential issues, ensuring stability and resilience in operations.
9. Better Collaboration Across Teams
By providing a centralized view of performance metrics, analytics promotes transparency and encourages cross-departmental collaboration. Teams can work together toward shared goals, aligning their efforts with organizational priorities.
10. Evidence-Based Innovation
Organizations can identify areas with high potential for growth or improvement and make innovation decisions based on solid data. Performance analytics helps prioritize initiatives with the greatest impact, fostering a culture of smart, evidence-driven experimentation.
Challenges of Performance Analytics
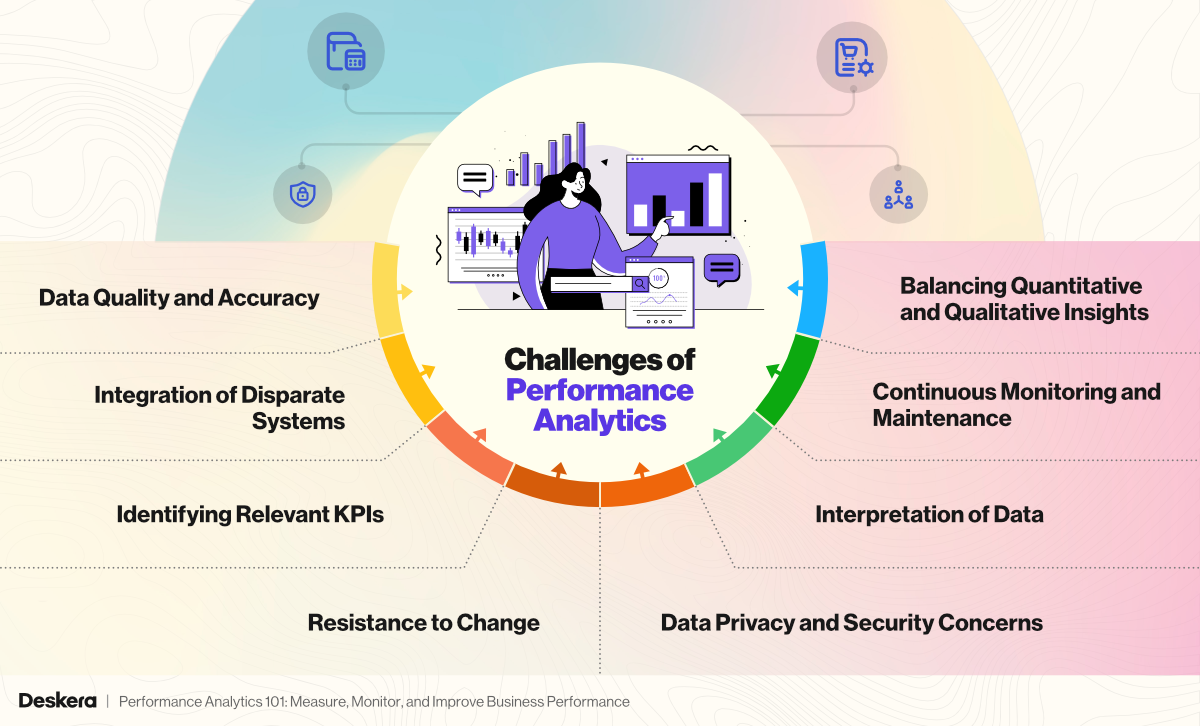
While performance analytics offers significant benefits, implementing it effectively comes with its own set of challenges. Businesses must be aware of these obstacles to ensure successful adoption and maximize the value of their data-driven insights.
1. Data Quality and Accuracy
The effectiveness of performance analytics depends heavily on the quality of data collected. Inaccurate, incomplete, or outdated data can lead to misleading insights, poor decisions, and misaligned strategies. Ensuring data integrity across multiple sources is a constant challenge for organizations.
2. Integration of Disparate Systems
Many organizations rely on multiple systems to manage operations, HR, finance, and sales. Integrating these systems to create a single source of truth for analytics can be complex, requiring technical expertise and careful planning to ensure consistency and reliability.
3. Identifying Relevant KPIs
Selecting the right KPIs is crucial for meaningful analysis. Organizations often struggle to determine which metrics truly reflect business performance and align with strategic objectives. Tracking too many or irrelevant KPIs can dilute insights and create confusion.
4. Resistance to Change
Implementing performance analytics often requires a cultural shift within the organization. Employees and managers may resist data-driven approaches, preferring traditional decision-making methods or fearing that analytics could be used punitively rather than constructively.
5. Data Privacy and Security Concerns
Collecting and analyzing performance data involves handling sensitive employee and business information. Ensuring compliance with data privacy regulations, such as GDPR or local labor laws, and protecting data from breaches is a critical challenge for organizations.
6. Interpretation of Data
Even with high-quality data, extracting meaningful insights requires analytical skills and experience. Misinterpretation of trends, correlations, or anomalies can lead to incorrect conclusions and ineffective strategies.
7. Continuous Monitoring and Maintenance
Performance analytics is an ongoing process, not a one-time project. Organizations need resources, tools, and commitment to continuously monitor, update, and refine their analytics processes. Without ongoing maintenance, dashboards and insights can become outdated and lose their value.
8. Balancing Quantitative and Qualitative Insights
Data-driven analytics can sometimes overlook qualitative factors, such as employee morale, team dynamics, or customer sentiment. Striking the right balance between numbers and context is essential for a complete understanding of performance.
Best Practices for Implementing Performance Analytics
Implementing performance analytics effectively requires a thoughtful strategy, collaboration, and the right tools. Following best practices ensures that your analytics efforts provide actionable insights and drive real organizational improvements.
1. Document Your Performance Analytics Process
Start by defining why you are using performance analytics. Are you aiming to improve team productivity, employee engagement, or goal alignment? Map out a clear workflow that shows how data will be collected, analyzed, and acted upon. A well-documented process ensures consistency, transparency, and smoother collaboration.
2. Set the Right KPIs
Choose Key Performance Indicators that are measurable, relevant, and aligned with your organizational goals. These could include metrics such as employee turnover, customer satisfaction, project completion timelines, or revenue per employee. KPIs act as scorecards to track meaningful progress and guide decision-making.
3. Ensure Data Quality and Integration
High-quality data is essential. Regularly clean and update your data sources to ensure accuracy and reliability. Avoid silos by integrating data from multiple systems, such as HR tools, surveys, performance reviews, and productivity platforms. Consistent and comprehensive data is the foundation of effective performance analytics.
4. Obtain Team Buy-In
Communicate openly with managers, employees, and stakeholders about the purpose of performance analytics. Address concerns, highlight benefits, and demonstrate how it supports growth and success. Aligning the process with company culture ensures engagement and reduces resistance to change.
5. Select Efficient Performance Analytics Software
Choose tools that provide meaningful insights and are easy to use. Evaluate software based on features, usability, and scalability. Test with a small team before full deployment to ensure the solution fits your organization’s needs.
6. Train Your Team on Data Skills
Equip your employees and managers with fundamental data analysis skills. Offer training on data interpretation, visualization, and reporting. Continuous learning ensures that insights are correctly understood and applied effectively.
7. Benchmark and Track Trends
Compare performance against historical data, industry standards, or peer organizations. Look for patterns and trends in the data to identify areas of success and opportunities for improvement. Benchmarking provides context and ensures your analytics are meaningful.
8. Generate Actionable Insights
Focus on insights that lead to real improvements. Prioritize actions that can enhance team performance, optimize processes, or improve employee development. Tailor recommendations to individual teams or employees to ensure relevance and effectiveness.
9. Protect Data Privacy and Security
Treat employee and organizational data as a valuable asset. Follow privacy regulations such as GDPR, implement strict access controls, and ensure sensitive information is protected. Secure data builds trust and supports ethical analytics practices.
10. Plan for Growth and Continuous Improvement
Design your analytics system to scale as your organization grows. Automate repetitive processes, stay flexible to accommodate new data sources, and involve your team in refining the approach. Continuous improvement ensures your performance analytics program remains effective and relevant over time.
Which KPIs to Track for Performance Analytics
Tracking the right Key Performance Indicators (KPIs) is essential for understanding business performance. KPIs quantify success, reveal trends, and highlight areas for improvement. Below is a comprehensive list of KPIs with formulas and extended insights:
1. Employee Productivity
Formula: Employee Productivity = Total Output / Number of Employees
Employee productivity measures the output generated per employee relative to resources used. It helps identify high-performing teams and efficiency gaps. Output can be measured in tasks completed, projects delivered, or revenue generated. By monitoring productivity, managers can allocate resources strategically, provide targeted support, and identify top performers for recognition or further development.
2. Goal Completion Rate
Formula: Goal Completion Rate (%) = (Number of Completed Goals / Total Goals Set) × 100
This KPI tracks how effectively teams or individuals achieve predefined objectives. It ensures alignment between employee efforts and organizational goals. Regularly measuring goal completion helps managers spot underperforming areas, identify obstacles, and optimize workflows to ensure strategic objectives are met on time.
3. Employee Engagement
Measurement Tools: Surveys, pulse polls, participation metrics
Engagement measures how motivated, committed, and satisfied employees are with their work and workplace. High engagement correlates with better productivity and retention. Tracking engagement trends over time allows organizations to create actionable strategies such as recognition programs, mentoring, and career development initiatives to boost morale and productivity.
4. Customer Satisfaction (CSAT)
Formula: CSAT (%) = (Satisfied Customers / Total Survey Responses) × 100
CSAT measures customer experience and satisfaction with products or services. Monitoring this KPI helps organizations identify service gaps, improve processes, and align team performance with customer expectations. Regularly tracking CSAT ensures that customers remain satisfied and loyal.
5. Net Promoter Score (NPS)
Formula: NPS = % Promoters - % Detractors
NPS measures customer loyalty and the likelihood of recommending your brand to others. High NPS indicates strong customer satisfaction, whereas a low score can highlight issues in product quality, service, or employee performance. It helps businesses prioritize improvements strategically.
6. Turnover Rate
Formula: Turnover Rate (%) = (Number of Employees Leaving / Average Number of Employees) × 100
Turnover indicates workforce stability and employee satisfaction. High turnover may signal engagement or performance issues. Tracking this KPI enables HR and managers to implement retention strategies, career development programs, and initiatives to improve workplace culture.
7. Retention Rate
Formula: Retention Rate (%) = 100 - Turnover Rate
Retention measures the percentage of employees staying over time. A high retention rate reflects strong employee engagement, effective leadership, and a healthy organizational culture. It is closely tied to productivity, morale, and overall business success.
8. Time to Complete Tasks or Projects
Formula: Average Task Completion Time = Total Time Spent on Tasks / Number of Tasks
This KPI measures operational efficiency by tracking how long it takes to complete specific tasks or projects. By monitoring completion times, managers can identify bottlenecks, streamline processes, and forecast project timelines more accurately, improving team performance and accountability.
9. Quality of Work (Defect Rate)
Formula: Defect Rate (%) = (Number of Defective Units / Total Units Produced) × 100
Quality of work measures accuracy, error rates, and compliance with standards. Monitoring quality ensures minimal errors, highlights training needs, and guarantees that customers receive consistent, high-value results. High-quality output reflects skilled employees and effective processes.
10. Attendance Rate
Formula: Attendance Rate (%) = (Days Present / Total Work Days) × 100
Attendance and punctuality are key indicators of workforce reliability. Monitoring absenteeism trends helps managers address underlying issues like burnout, workload imbalance, or policy gaps, ensuring consistent team performance and operational efficiency.
11. Training Completion Rate
Formula: Training Completion Rate (%) = (Employees Completed Training / Total Employees Enrolled) × 100
Tracks employee growth through skill development and completion of training programs. Monitoring this KPI ensures employees are acquiring the skills needed to perform effectively, prepare for future responsibilities, and contribute to organizational goals.
12. Revenue per Employee
Formula: Revenue per Employee = Total Revenue / Number of Employees
Revenue per employee reflects financial contribution at the individual level. Tracking this KPI ensures teams are working efficiently, highlights high-value areas, and informs decisions regarding resource allocation, hiring, and performance incentives.
13. Profit per Employee
Formula: Profit per Employee = Net Profit / Number of Employees
Profit per employee shows each team member’s contribution to the organization’s bottom line. Monitoring this KPI helps assess efficiency, optimize staffing, and improve profitability.
14. Process Efficiency
Formula: Process Efficiency (%) = (Value-Added Time / Total Process Time) × 100
This KPI tracks operational effectiveness, identifying bottlenecks and inefficiencies. High process efficiency reduces costs, shortens delivery timelines, and ensures smooth workflow management, enhancing overall productivity.
15. Employee Utilization Rate
Formula: Utilization Rate (%) = (Billable/Project Hours / Total Available Hours) × 100
Measures how effectively employees’ time is spent on productive tasks. Monitoring utilization helps managers optimize workloads, balance responsibilities, and improve overall performance.
16. Overtime Hours
Tracks extra hours worked. Excessive overtime can indicate workload imbalances, process inefficiencies, or employee burnout, requiring proactive adjustments in staffing or workflow.
17. Employee Satisfaction and Wellbeing Scores
Measures morale, stress levels, and satisfaction using surveys or wellness assessments. High wellbeing scores correlate with higher engagement, lower turnover, and improved productivity across the organization.
18. Innovation and Idea Contribution
Tracks employee suggestions, initiatives, or process improvements. Encouraging innovation fosters engagement, continuous improvement, and a proactive workplace culture.
19. Project Success Rate
Formula: Project Success Rate (%) = (Successful Projects / Total Projects) × 100
Evaluates the percentage of projects delivered on time, within budget, and meeting quality standards. It reflects operational efficiency and project management effectiveness.
20. Customer Retention Rate
Formula: Customer Retention Rate (%) = ((Customers at End of Period - New Customers) / Customers at Start of Period) × 100
Measures how well a business retains customers over time. High retention reflects strong performance in service delivery, engagement, and team effectiveness.
21. Cost per Hire
Formula: Cost per Hire = Total Recruitment Cost / Number of Hires
Assesses recruitment efficiency and HR effectiveness. Optimizing this KPI ensures cost-effective talent acquisition aligned with business growth.
22. Internal Collaboration Metrics
Tracks cross-team communication, knowledge sharing, and collaboration efficiency. Strong collaboration leads to higher productivity, innovation, and better employee performance.
23. Compliance and Regulatory Metrics
Monitors adherence to internal policies, industry standards, and legal regulations. Ensuring compliance reduces organizational risk and supports ethical operations.
24. Employee Goal Alignment Score
Measures how well individual objectives align with team and organizational goals. Alignment ensures that all employee efforts contribute meaningfully to business priorities.
How Deskera ERP Helps with Performance Analytics
In a competitive business environment, the ability to measure, analyze, and act on performance data can make all the difference between steady growth and stagnation. Deskera ERP transforms raw data into actionable insights—helping organizations track key performance indicators, uncover inefficiencies, and make smarter decisions faster. Its integrated tools bridge data silos and bring financial, operational, and HR data together in one unified platform.
Here’s how Deskera ERP empowers businesses with performance analytics:
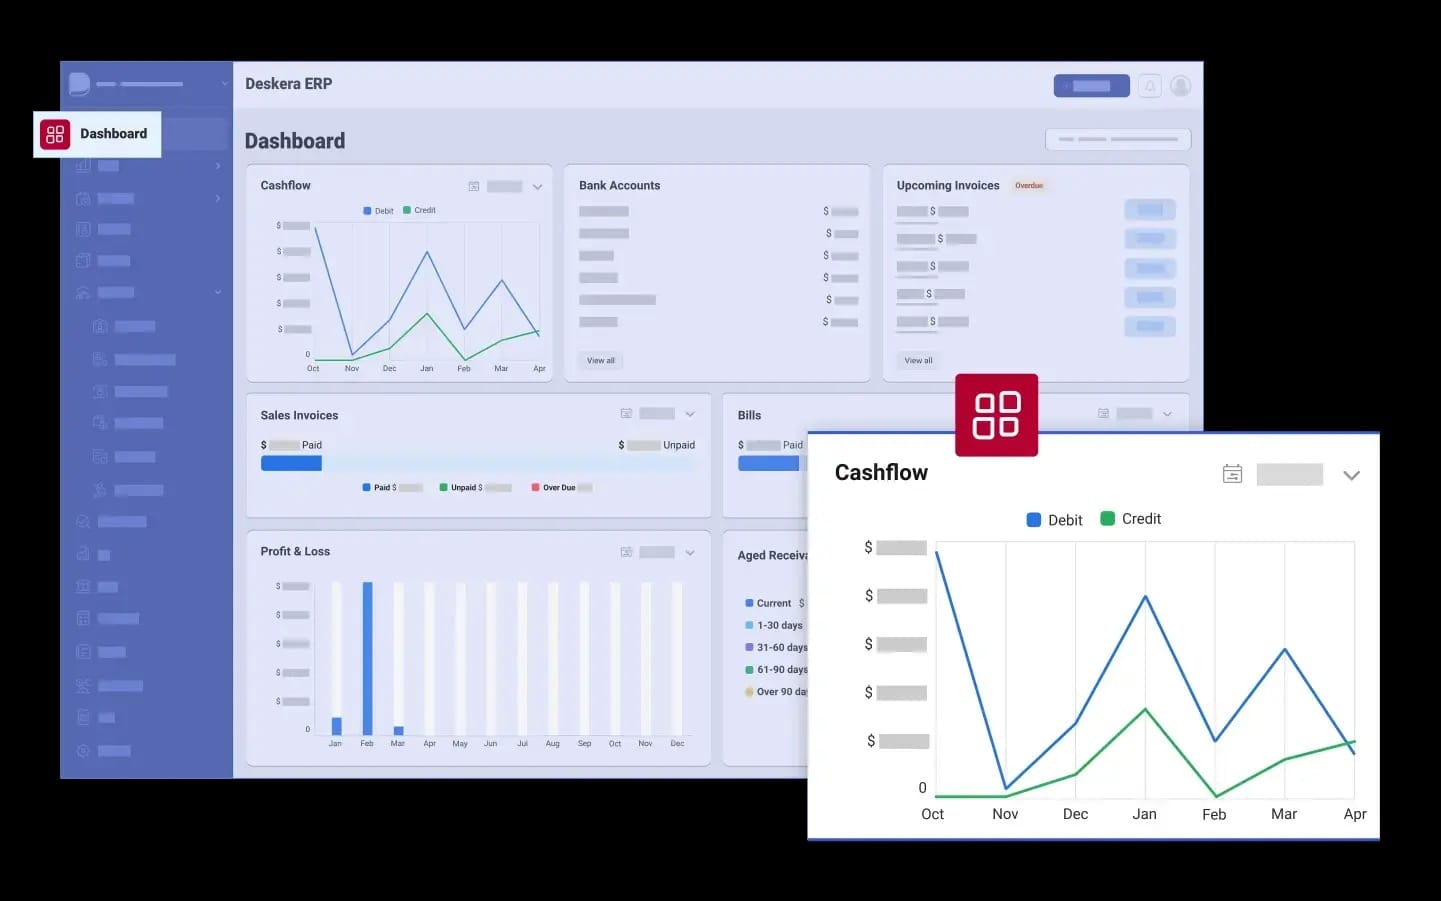
1. Centralized Data Visibility
Deskera ERP consolidates information from multiple departments—finance, sales, and, production—into a single, unified dashboard. This 360° visibility allows decision-makers to monitor performance metrics in real time without switching between tools. Leaders can quickly identify bottlenecks, track progress, and make data-driven adjustments across teams.
2. Real-Time KPI Tracking
With Deskera ERP, businesses can define and track custom Key Performance Indicators (KPIs) that align with organizational goals. Whether it’s sales conversion rates, production efficiency, or employee productivity, the system automatically updates dashboards with the latest data—allowing instant insight into current performance.
3. AI-Powered Insights with David, the AI Assistant
Deskera’s AI assistant, David, simplifies performance analytics through conversational commands and intelligent suggestions. It can generate reports, highlight trends, and even predict potential performance issues—making analytics accessible to non-technical users while saving time and effort.
4. Advanced Reporting and Visualization
Deskera ERP offers advanced reporting templates with visual dashboards, charts, and analytics summaries. These reports transform complex data into easy-to-understand visuals that highlight patterns, growth areas, and potential risks. Managers can schedule automatic reports to keep stakeholders informed.
5. Performance-Linked Financial Analysis
Performance analytics is not limited to operations—Deskera ERP also integrates financial data. Businesses can track profitability per product line, monitor expenses, and evaluate cost efficiency to ensure that performance improvements align with financial sustainability.
6. Workflow Automation and Alerts
Automated workflows and intelligent alerts help ensure that underperformance doesn’t go unnoticed. For example, if project costs exceed a set limit or a KPI falls below a benchmark, the system instantly notifies relevant teams—enabling faster corrective actions and better accountability.
7. Continuous Performance Monitoring
Unlike static reporting tools, Deskera ERP enables continuous performance tracking. Businesses can compare current results with historical trends, identify seasonal variations, and refine strategies based on data-backed insights—leading to ongoing improvement rather than periodic evaluation.
Deskera ERP serves as a complete performance analytics ecosystem—bringing together data, intelligence, and automation. From tracking KPIs in real time to generating predictive insights through AI, it enables organizations to transform performance data into business excellence.
By empowering decision-makers with accurate, timely insights, Deskera helps businesses move beyond guesswork—ensuring that every strategy, investment, and team effort contributes meaningfully to long-term growth.
Key Takeaways
- Performance analytics turns raw business data into actionable insights, empowering organizations to make smarter, data-driven decisions. With tools like Deskera ERP, companies can centralize data and monitor performance metrics that align directly with strategic goals.
- The main goal of performance analytics is to provide clarity and direction for organizational growth. It helps businesses identify strengths, uncover inefficiencies, and align resources more effectively to achieve measurable outcomes.
- While performance analytics provides continuous, data-driven insights into performance trends, performance appraisals focus on periodic individual evaluations. Integrating both creates a holistic system for growth, accountability, and organizational excellence.
- Performance analytics follows a structured process of data collection, analysis, interpretation, and continuous improvement. By transforming data into strategic insights, organizations can enhance agility, improve decision-making, and sustain growth in a competitive market.
- Performance analytics empowers organizations to move beyond intuition and base decisions on solid data. By identifying patterns, predicting trends, and measuring real outcomes, it enhances productivity, reduces bias, and supports continuous employee development. Ultimately, it drives smarter strategies, improved efficiency, and long-term business growth.
- Despite its benefits, performance analytics faces challenges such as data quality issues, fragmented systems, lack of analytical expertise, and resistance to change. Overcoming these hurdles requires strong governance, robust tools, and a data-driven culture.
- Successful implementation begins with setting clear objectives, establishing the right KPIs, ensuring data accuracy, and gaining team buy-in. Transparency, regular benchmarking, and continuous learning are key to maintaining impactful analytics processes.
- Tracking the right KPIs—such as employee productivity, goal achievement rate, turnover rate, revenue per employee, and cost per hire—enables businesses to measure progress effectively. Using formulas and consistent tracking ensures accurate, actionable results.
- Deskera ERP simplifies performance analytics by centralizing data, offering real-time KPI tracking, and providing AI-powered insights through its assistant, David. Its automation and visualization tools empower leaders to make informed, timely decisions that drive business success.
Related Articles