
Are your maintenance metrics helping you prevent failures—or just reporting them after the damage is done? For many operations managers, maintenance KPIs still function as rearview mirrors rather than forward-looking tools. In 2025, that approach is no longer enough. With rising production pressures, tighter margins, and increasingly complex assets, maintenance performance must be measured in ways that actively support uptime, reliability, and cost control.
Maintenance KPIs have evolved from simple downtime trackers into strategic indicators of operational health. Metrics such as MTBF, MTTR, OEE, and planned maintenance ratios now play a direct role in shaping preventive and predictive maintenance strategies. When tracked correctly, these KPIs help operations managers identify failure patterns early, optimize maintenance schedules, and align maintenance efforts with broader business goals.
The urgency to track the right maintenance KPIs is greater than ever in 2025. Aging equipment, skilled labor shortages, and the growing adoption of automation and IoT have made maintenance both more data-rich and more complex. Operations managers must move beyond tracking “everything” and focus instead on KPIs that deliver clear, actionable insights—ones that reduce unplanned downtime, improve asset utilization, and support long-term operational resilience.
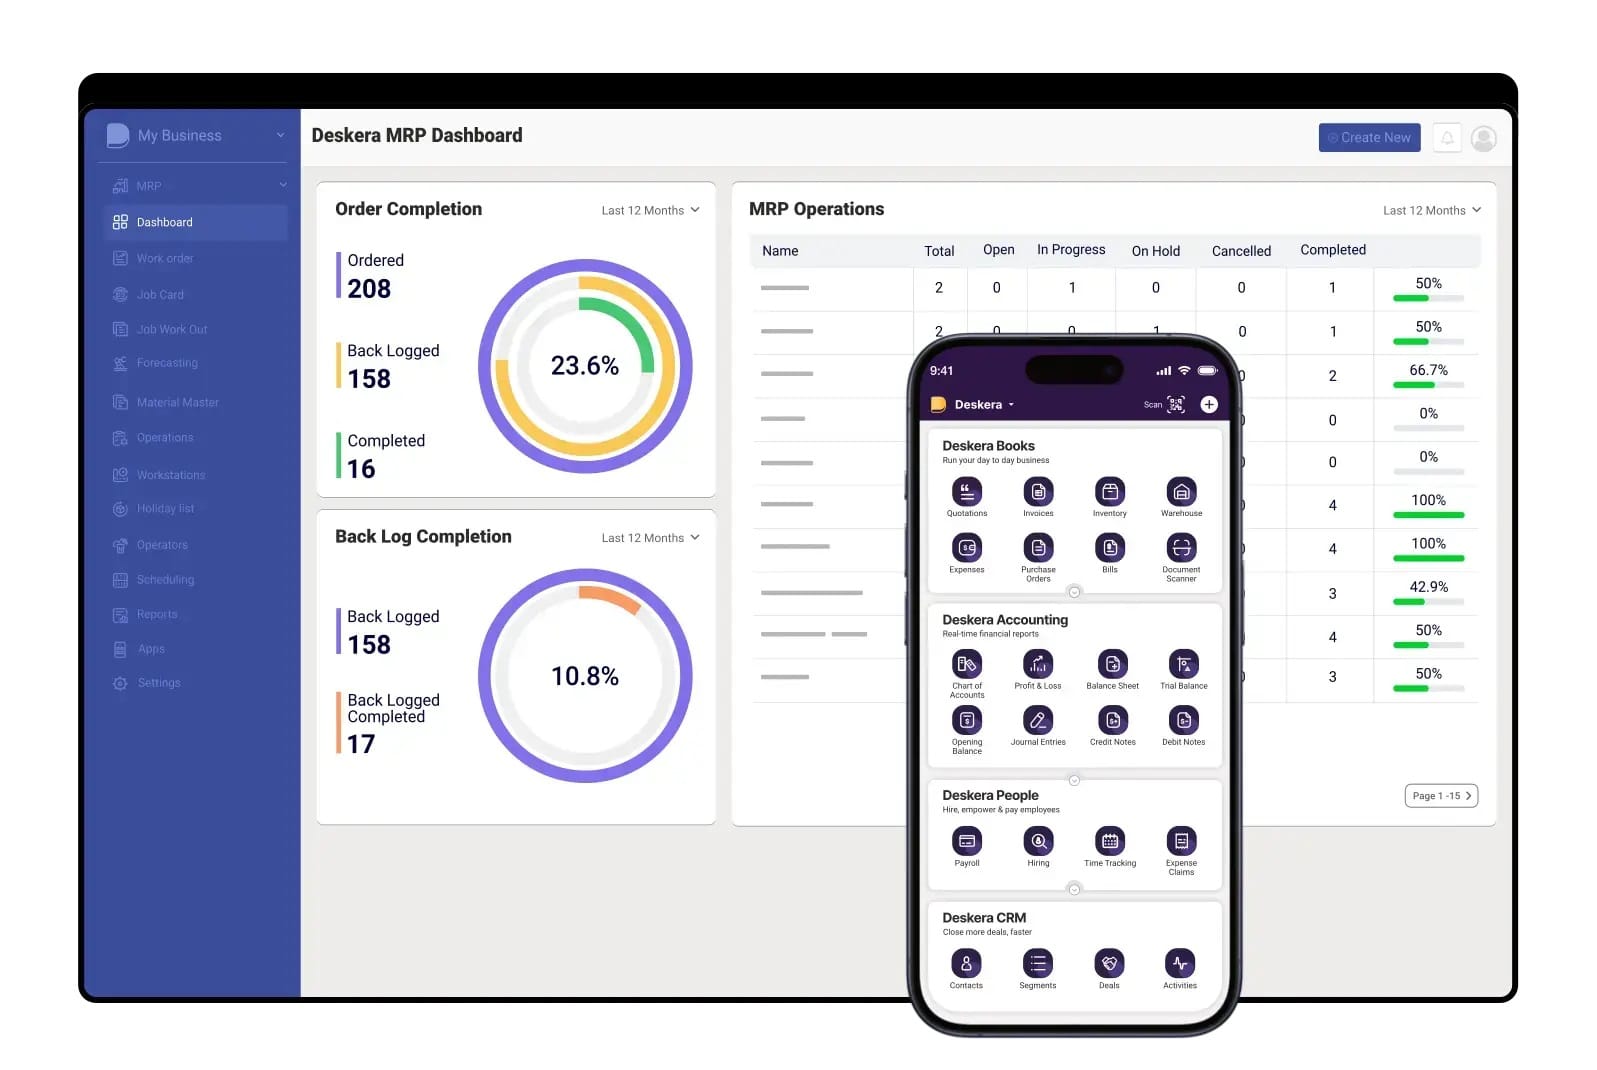
This is where Deskera Manufacturing ERP plays a critical role. Deskera provides centralized visibility into maintenance activities, asset performance, work orders, and inventory—all in real time. With integrated maintenance tracking, automated reporting, and data-driven dashboards, Deskera helps operations managers monitor key maintenance KPIs accurately and act on them faster. By connecting maintenance data with production and financial insights, Deskera enables smarter, more proactive maintenance decisions in 2025 and beyond.
Maintenance Metrics vs Maintenance KPIs
Although maintenance metrics and maintenance KPIs are often used interchangeably, they play different roles in maintenance performance management. Metrics capture what is happening on the ground, while KPIs translate that data into goal-driven insights. Understanding how they work together helps operations managers shift from activity tracking to continuous improvement.
What Are Maintenance Metrics?
Maintenance metrics are quantitative data points that measure day-to-day maintenance activities and outcomes. They focus on actual performance and operational results.
Key characteristics of maintenance metrics:
- Measure what has already happened
- Track operational and technical performance
- Used for monitoring trends and identifying issues
Common examples of maintenance metrics include:
- Equipment uptime and downtime
- Mean Time Between Failures (MTBF)
- Mean Time to Repair (MTTR)
- Number of preventive maintenance tasks completed
- Maintenance labor hours
Metrics primarily answer the question: “What happened?”
What Are Maintenance KPIs?
Maintenance KPIs (Key Performance Indicators) are target-based benchmarks built using maintenance metrics. They define what success looks like and measure progress toward maintenance and business goals.
Key characteristics of maintenance KPIs:
- Combine a metric with a defined target
- Aligned with organizational and maintenance objectives
- Designed to drive improvement and accountability
Example:
- Metric: Asset uptime
- KPI: Increase asset uptime by 15% within the next 12 months
KPIs answer the question: “Are we meeting our maintenance goals?”
Metrics vs KPIs: How They Differ in Practice
The core difference lies in measurement versus intent.
- Metrics report actual performance
- Example: 8 preventive maintenance tasks completed today
- KPIs define expected performance
- Example: Target of 10 preventive maintenance tasks per day
In simple terms:
- Metrics show what is happening
- KPIs show what should be happening
Leading vs Lagging Indicators in Maintenance
Maintenance KPIs and metrics can be classified as leading or lagging indicators, and effective maintenance management uses both.
Lagging indicators (results-focused):
- MTBF
- MTTR
- Total downtime
- Maintenance cost per asset
Leading indicators (predictive and preventive):
- Preventive maintenance compliance
- Schedule adherence
- Planned maintenance percentage
- Estimate vs. actual work performance
Leading indicators help prevent failures, while lagging indicators measure the impact of past events.
Why Both Metrics and KPIs Matter
Using metrics without KPIs leads to data overload without direction, while KPIs without reliable metrics lack accuracy.
Together, they help organizations:
- Reduce downtime and equipment failures
- Improve work planning and scheduling
- Control maintenance costs
- Align maintenance activities with business goals
- Build a data-driven maintenance culture
When tracked through a CMMS or ERP system, maintenance metrics and KPIs are transformed into actionable dashboards and insights, enabling smarter decisions and continuous improvement.
Why Do Maintenance KPIs Matter in 2026?
In 2026, maintenance is no longer a support function—it is a strategic driver of operational resilience, cost efficiency, and business continuity. With increasing asset complexity, tighter margins, and higher customer expectations, maintenance KPIs provide the visibility and control operations managers need to stay competitive. The right KPIs turn maintenance data into actionable insights that support proactive decision-making and long-term performance.
Rising Equipment Complexity and Automation
Modern production environments rely heavily on automated, interconnected, and sensor-driven equipment. As machines become more complex, failures are harder to predict and more expensive to fix.
Maintenance KPIs help by:
- Identifying early signs of asset degradation
- Measuring the effectiveness of preventive and predictive maintenance
- Ensuring critical assets receive the right level of attention
Higher Cost Pressures and Margin Sensitivity
Inflation, supply chain volatility, and rising labor costs have made unplanned downtime significantly more expensive in 2026.
Maintenance KPIs enable organizations to:
- Track and control maintenance spending
- Reduce emergency repairs and overtime costs
- Optimize maintenance budgets based on asset criticality
Shift From Reactive to Predictive Maintenance
Reactive maintenance is no longer sustainable in asset-intensive industries. Organizations are increasingly moving toward predictive and condition-based maintenance models.
KPIs support this shift by:
- Measuring preventive maintenance compliance
- Tracking failure trends and recurring issues
- Validating whether predictive strategies are actually reducing breakdowns
Workforce Challenges and Skill Gaps
The ongoing shortage of skilled maintenance technicians has made efficiency and productivity more important than ever.
Maintenance KPIs help operations managers:
- Monitor workforce utilization and response times
- Improve work planning and scheduling
- Ensure limited resources are used where they create the most value
Greater Focus on Reliability, Safety, and Compliance
Regulatory requirements and safety standards continue to tighten across industries in 2026.
Maintenance KPIs allow organizations to:
- Track compliance-related maintenance activities
- Reduce safety incidents caused by equipment failure
- Demonstrate audit readiness with measurable performance data
Data-Driven Decision-Making and Digital Transformation
With ERP, CMMS, IoT, and AI systems generating massive volumes of data, organizations need structured ways to interpret performance.
Maintenance KPIs matter because they:
- Convert raw maintenance data into meaningful insights
- Enable real-time visibility through dashboards and reports
- Align maintenance performance with broader operational and business goals
In 2026, maintenance KPIs are not just about tracking performance—they are essential tools for improving reliability, controlling costs, and building a future-ready maintenance strategy.
Categories of Maintenance KPIs Operations Managers Should Track
Maintenance KPIs can be grouped into clear categories to help operations managers monitor performance without being overwhelmed by data. Each category focuses on a specific aspect of maintenance effectiveness, ensuring a balanced view of reliability, efficiency, cost control, and compliance.
Reliability and Asset Performance KPIs
These KPIs measure how consistently equipment performs and how often failures occur. They are critical for improving uptime and extending asset life.
Key KPIs include:
- Mean Time Between Failures (MTBF)
- Overall Equipment Effectiveness (OEE)
- Equipment availability
- Failure rate
Maintenance Efficiency and Productivity KPIs
Efficiency KPIs evaluate how well maintenance teams use time, labor, and resources to complete work.
Key KPIs include:
- Mean Time to Repair (MTTR)
- Schedule compliance
- Planned maintenance percentage (PMP)
- Work order completion rate
Downtime and Responsiveness KPIs
These KPIs focus on how quickly issues are identified and resolved, and how much production time is lost due to maintenance events.
Key KPIs include:
- Equipment downtime percentage
- Emergency maintenance rate
- Maintenance response time
- Backlog of corrective work
Cost and Financial Performance KPIs
Cost-related KPIs help operations managers control maintenance spending and evaluate return on assets.
Key KPIs include:
- Maintenance cost as a percentage of asset value (RAV)
- Maintenance cost per unit produced
- Labor vs. material cost ratio
- Overtime maintenance costs
Preventive and Predictive Maintenance KPIs
These KPIs measure how effectively preventive and predictive strategies are being executed.
Key KPIs include:
- Preventive maintenance (PM) compliance
- Ratio of planned vs. unplanned maintenance
- Predictive maintenance success rate
- Repeat failure rate
Inventory and Spare Parts Management KPIs
Inventory KPIs ensure spare parts availability while minimizing excess stock and carrying costs.
Key KPIs include:
- Spare parts inventory turnover
- Stockout rate
- Inventory carrying cost
- Critical spares availability
Safety, Compliance, and Quality KPIs
These KPIs track how maintenance activities support workplace safety, regulatory compliance, and quality standards.
Key KPIs include:
- Maintenance-related safety incidents
- Compliance audit pass rate
- Maintenance rework rate
- Equipment-related quality defects
By tracking KPIs across these categories, operations managers gain a comprehensive view of maintenance performance—helping them balance reliability, efficiency, cost control, and risk management in 2026 and beyond.
Top Maintenance KPIs Every Operations Manager Should Track in 2026
In 2026, maintenance success depends on visibility, predictability, and execution discipline. Operations managers must track a complete set of maintenance KPIs, not just a few popular metrics, to balance reliability, cost control, workforce efficiency, and compliance. The KPIs below cover all critical maintenance dimensions required for modern, asset-intensive operations.
Mean Time Between Failures (MTBF)
Category: Reliability & Asset Performance
Measures the average time equipment operates before failing.
Why it matters in 2026:
- Indicates asset reliability and maintenance effectiveness
- Helps prioritize preventive and predictive maintenance
Formula:
MTBF = Total Operating Time ÷ Number of Failures
Mean Time to Repair (MTTR)
Category: Maintenance Efficiency
Measures how quickly equipment is restored after failure.
Why it matters in 2026:
- Faster repairs reduce downtime losses
- Highlights technician efficiency and spare-part readiness
Formula:
MTTR = Total Repair Time ÷ Number of Repairs
Overall Equipment Effectiveness (OEE)
Category: Asset Performance
Combines availability, performance, and quality into one KPI.
Why it matters in 2026:
- Connects maintenance performance directly to production output
- Identifies losses caused by breakdowns, slow cycles, and defects
Formula:
OEE = Availability × Performance × Quality
Equipment Availability
Category: Reliability
Measures the percentage of time equipment is available for operation.
Why it matters in 2026:
- Reflects maintenance responsiveness and planning quality
- Directly impacts production capacity
Equipment Downtime Percentage
Category: Downtime & Responsiveness
Tracks the proportion of time assets are unavailable.
Why it matters in 2026:
- Downtime remains one of the highest operational cost drivers
- Helps distinguish planned vs. unplanned maintenance impact
Formula:
Downtime % = (Downtime Hours ÷ Total Operating Hours) × 100
Unscheduled (Unplanned) Downtime
Category: Downtime Control
Measures downtime caused by unexpected failures.
Why it matters in 2026:
- Indicates maturity of preventive and predictive maintenance
- High values signal reactive maintenance dependency
Preventive Maintenance (PM) Compliance
Category: Preventive Maintenance
Measures how many scheduled PM tasks are completed on time.
Why it matters in 2026:
- Strong PM compliance reduces failures and emergency work
- Indicates planning discipline
Benchmark:
- 90%+ compliance
Planned Maintenance Percentage (PMP)
Category: Maintenance Planning
Shows how much work is planned versus reactive.
Why it matters in 2026:
- Higher PMP means fewer firefighting activities
- Reflects maintenance maturity
Formula:
PMP = (Planned Maintenance Hours ÷ Total Maintenance Hours) × 100
Reactive Maintenance Percentage
Category: Maintenance Strategy
Tracks the share of unplanned maintenance work.
Why it matters in 2026:
- High reactive maintenance increases cost and risk
- Indicates poor preventive execution
Schedule Compliance
Category: Execution & Control
Measures how often scheduled work is completed as planned.
Why it matters in 2026:
- Reflects coordination between maintenance and operations
- Improves resource utilization
Work Order Completion Rate
Category: Task Management
Measures the percentage of work orders completed within a period.
Why it matters in 2026:
- Shows workload balance and execution efficiency
- Highlights bottlenecks in approval or execution
Maintenance Backlog
Category: Resource Planning
Tracks pending maintenance work relative to available labor.
Why it matters in 2026:
- Excess backlog signals understaffing or rising failures
- Too little backlog may indicate poor work identification
Measured as:
- Weeks of work or total labor hours
Maintenance Technician Productivity
Category: Workforce Efficiency
Measures productive time versus total available time.
Why it matters in 2026:
- Skilled labor shortages make productivity critical
- Identifies delays caused by planning or inventory issues
Maintenance Cost per Unit Produced
Category: Cost Control
Tracks maintenance cost relative to output.
Why it matters in 2026:
- Links maintenance spending directly to production efficiency
- Enables cross-plant and asset comparisons
Maintenance Cost as a Percentage of Replacement Asset Value (RAV)
Category: Financial Performance
Measures maintenance spending relative to asset value.
Why it matters in 2026:
- Prevents overspending on aging assets
- Supports repair vs. replace decisions
Maintenance Cost Relative to Estimated Replacement Value (MC/ERV)
Category: Asset Lifecycle Management
Compares maintenance cost to replacement cost.
Why it matters in 2026:
- Identifies assets nearing economic end-of-life
- Supports capital planning
Spare Parts Inventory Turnover
Category: Inventory Management
Measures how efficiently spare parts are used.
Why it matters in 2026:
- Balances availability with carrying costs
- Prevents excess or obsolete inventory
Spare Parts Stockout Rate
Category: Inventory Risk
Tracks how often required parts are unavailable.
Why it matters in 2026:
- Stockouts increase MTTR and downtime
- Indicates poor inventory planning
First Pass Yield (FPY)
Category: Quality & Effectiveness
Measures how often work is completed correctly the first time.
Why it matters in 2026:
- Reduces rework and repeat failures
- Reflects maintenance quality
Maintenance-Related Safety Incidents
Category: Safety & Compliance
Tracks incidents caused by equipment or maintenance failures.
Why it matters in 2026:
- Safety compliance is non-negotiable
- Equipment reliability directly impacts workplace safety
Compliance Audit Pass Rate
Category: Regulatory Compliance
Measures adherence to maintenance and safety standards.
Why it matters in 2026:
- Ensures audit readiness
- Reduces legal and operational risk
Failure Rate
Category: Reliability & Asset Performance
Measures how frequently an asset fails within a given period.
Why it matters in 2026:
- Helps identify unreliable equipment
- Supports root cause analysis and asset prioritization
Formula:
Failure Rate = Number of Failures ÷ Total Operating Time
Emergency Maintenance Rate
Category: Downtime & Responsiveness
Tracks the percentage of maintenance work that is unplanned and urgent.
Why it matters in 2026:
- High rates indicate reactive maintenance dependency
- Emergency work is more costly and disruptive
Formula:
Emergency Maintenance Rate = (Emergency Work Orders ÷ Total Work Orders) × 100
Maintenance Response Time
Category: Downtime & Responsiveness
Measures the time taken to respond after a failure or maintenance request is reported.
Why it matters in 2026:
- Faster response reduces downtime impact
- Reflects coordination between operations and maintenance
Formula:
Response Time = Time of First Action − Time of Failure Report
Labor vs. Material Cost Ratio
Category: Cost & Financial Performance
Compares labor costs to spare parts and material costs.
Why it matters in 2026:
- Highlights inefficiencies in workforce utilization or inventory usage
- Helps optimize maintenance budgets
Formula:
Labor vs. Material Ratio = Labor Costs ÷ Material Costs
Overtime Maintenance Costs
Category: Cost Control
Tracks the portion of maintenance labor cost spent on overtime.
Why it matters in 2026:
- Excessive overtime signals poor planning or staffing gaps
- Directly increases maintenance expenses
Formula:
Overtime Cost % = (Overtime Maintenance Cost ÷ Total Maintenance Labor Cost) × 100
Predictive Maintenance Success Rate
Category: Predictive Maintenance
Measures how effectively predictive maintenance prevents failures.
Why it matters in 2026:
- Validates ROI of condition monitoring and IoT investments
- Ensures predictive alerts lead to action
Formula:
PdM Success Rate = (Failures Prevented ÷ Total PdM Alerts) × 100
Repeat Failure Rate
Category: Reliability Improvement
Tracks how often the same asset fails repeatedly after repair.
Why it matters in 2026:
- Indicates poor root cause analysis or low repair quality
- Drives continuous improvement initiatives
Formula:
Repeat Failure Rate = (Repeat Failures ÷ Total Failures) × 100
Inventory Carrying Cost
Category: Inventory Management
Measures the cost of holding spare parts inventory over time.
Why it matters in 2026:
- Excess inventory ties up capital
- Helps balance availability with cost efficiency
Formula:
Inventory Carrying Cost = Storage + Insurance + Obsolescence + Capital Costs
Critical Spares Availability
Category: Inventory Risk Management
Tracks the availability of high-risk, high-impact spare parts.
Why it matters in 2026:
- Prevents extended downtime due to missing critical components
- Supports risk-based inventory planning
Formula:
Critical Spares Availability = (Available Critical Spares ÷ Total Required Critical Spares) × 100
Maintenance Rework Rate
Category: Quality & Effectiveness
Measures how often maintenance tasks must be redone due to improper execution.
Why it matters in 2026:
- High rework increases downtime and cost
- Reflects skill gaps or procedural issues
Formula:
Rework Rate = (Rework Work Orders ÷ Total Work Orders) × 100
Equipment-Related Quality Defects
Category: Quality & Production Impact
Tracks production defects caused by equipment or maintenance issues.
Why it matters in 2026:
- Connects maintenance performance directly to product quality
- Helps justify maintenance investment
Formula:
Equipment-Related Defects = Defective Units Attributed to Equipment Issues
In 2026, operations managers must track a complete ecosystem of maintenance KPIs, not isolated metrics. When reliability, efficiency, cost, inventory, workforce, and safety KPIs are viewed together, maintenance shifts from a reactive cost center to a strategic driver of operational resilience and profitability.
Benefits of Tracking Maintenance KPIs
Tracking maintenance KPIs goes far beyond monitoring numbers—it enables organizations to make smarter decisions, improve asset reliability, and drive measurable operational and financial gains.
When maintenance performance is consistently measured and analyzed, maintenance shifts from a reactive cost center to a strategic business function.
Improved Decision-Making
Maintenance KPIs provide accurate, real-time visibility into maintenance performance, enabling data-driven decisions instead of assumptions.
Key benefits include:
- Clear insights into what is working and what needs improvement
- Better prioritization of critical maintenance tasks
- More effective allocation of labor, tools, and spare parts
By relying on KPI-driven insights, operations managers can address issues proactively and focus resources where they create the most impact.
Reduced Downtime and Improved Equipment Availability
KPIs such as MTTR, PM compliance, and downtime percentage highlight opportunities to minimize equipment outages.
How KPIs help:
- Identify bottlenecks that increase repair time
- Strengthen preventive maintenance programs
- Reduce unexpected breakdowns and emergency repairs
Lower downtime directly improves production continuity and customer commitments.
Increased Equipment Reliability and Asset Lifespan
Maintenance KPIs reveal trends and patterns that affect long-term asset performance.
Reliability-focused benefits include:
- Early detection of recurring failures
- Improved root cause analysis
- Extended equipment lifespan through proactive maintenance
Reliable assets reduce capital expenditure pressure and improve return on asset investments.
Improved Operational Efficiency
By tracking KPIs like OEE, schedule compliance, and technician productivity, organizations can uncover inefficiencies in maintenance execution.
Efficiency gains include:
- Optimized maintenance schedules
- Better utilization of maintenance teams
- Reduced idle time and rework
This leads to smoother operations and higher overall productivity.
Cost Control and Maintenance Cost Reduction
Maintenance KPIs provide visibility into where money is being spent—and where it’s being wasted.
Cost-related advantages include:
- Lower overtime and emergency maintenance costs
- Reduced material waste and excess inventory
- Better control over maintenance budgets
Tracking cost KPIs helps organizations balance reliability with financial discipline.
Identification of Continuous Improvement Opportunities
KPIs make performance gaps visible and measurable.
Continuous improvement benefits include:
- Clear benchmarks for success
- Data-backed improvement initiatives
- Measurable progress over time
This creates a culture of accountability and ongoing optimization.
Better Resource Planning and Utilization
Maintenance KPIs help align workforce capacity, spare parts, and schedules with actual operational needs.
Planning benefits include:
- Improved workload balancing
- Reduced maintenance backlogs
- Higher technician productivity
Efficient resource planning ensures maintenance teams are neither overburdened nor underutilized.
Stronger Alignment Between Maintenance and Business Goals
When maintenance KPIs are linked to production, cost, and quality outcomes, maintenance efforts support broader organizational objectives.
Business-level benefits include:
- Improved profitability through reduced downtime
- Higher customer satisfaction from reliable operations
- Stronger justification for maintenance investments
In 2026, tracking maintenance KPIs is essential for organizations that want to remain competitive, resilient, and efficient. By focusing on the right KPIs, operations managers gain the clarity needed to reduce downtime, optimize costs, and build a proactive, data-driven maintenance strategy.
How to Choose the Right Maintenance KPIs
Choosing the right maintenance KPIs is not about tracking everything—it’s about tracking what truly drives performance, reliability, and cost control. With operations becoming more data-driven in 2026, operations managers must be deliberate in selecting KPIs that align with business goals, asset criticality, and long-term improvement initiatives.
Before diving into tracking methods, it’s essential to first get KPI selection right.
Align KPIs With Business and Operational Goals
Every maintenance KPI should tie directly to a broader business objective. If the organization’s priority is cost optimization, KPIs like Maintenance Cost as a Percentage of Asset Value (MCAV) or Planned vs. Unplanned Maintenance Ratio become critical. If uptime and customer commitments are the focus, KPIs such as Equipment Availability, MTBF, and Downtime Percentage take precedence.
Consider Asset Criticality and Risk
Not all assets deserve the same level of KPI tracking. High-risk or production-critical equipment should have more detailed KPIs tied to reliability, failure frequency, and response times. For example:
- Critical assets may require MTBF, MTTR, and Preventive Maintenance Compliance
- Non-critical assets may only need basic uptime or cost tracking
This approach prevents KPI overload while ensuring the most impactful assets receive focused attention.
Balance Leading and Lagging Indicators
A strong KPI framework includes both predictive and outcome-based indicators.
- Leading indicators (such as Preventive Maintenance Compliance or Schedule Compliance) help predict future performance.
- Lagging indicators (such as MTTR, MTBF, and Downtime) show the results of past actions.
Relying solely on lagging KPIs limits proactive decision-making.
Ensure KPIs Are Actionable and Measurable
A KPI is only valuable if it drives action. Ask:
- Can this KPI influence decision-making?
- Is it measurable with available ERP data?
- Can teams realistically improve it?
For example, tracking “number of breakdowns” without context offers limited insight. In contrast, tracking Breakdown Frequency alongside Root Cause Analysis Completion Rate provides clarity and direction.
Avoid vague KPIs that lack ownership or clear improvement paths.
Limit the Number of KPIs Tracked
More KPIs do not equal better performance. Tracking too many dilutes focus and reduces accountability. Most operations teams perform best with:
- 5–7 core KPIs at the leadership level
- Supporting KPIs at the team or asset level
This focused approach ensures KPIs remain visible, relevant, and consistently reviewed.
Validate KPI Feasibility Using ERP Data
Before finalizing KPIs, confirm that your ERP system can reliably capture the required data. Maintenance KPIs should be based on automated, real-time inputs such as work orders, asset histories, labor hours, and spare parts usage. This avoids manual reporting gaps and ensures KPI accuracy.
Review KPIs as the Business Evolves
The right KPIs today may not remain relevant tomorrow. As operations scale, assets age, or maintenance strategies shift from reactive to predictive, KPIs should be reassessed. However, frequent changes should be avoided—KPIs should evolve gradually, not reset entirely.
Once the right maintenance KPIs are selected, the real impact comes from how consistently and effectively they are tracked, analyzed, and acted upon—this is where best practices make the difference.
Best Practices for Tracking Maintenance KPIs
Tracking maintenance KPIs effectively requires more than selecting the right metrics—it demands a structured, disciplined, and data-driven approach. When done correctly, maintenance KPI tracking helps organizations improve reliability, reduce downtime, control costs, and align maintenance efforts with broader business goals.
The following best practices will help operations managers get the most value from maintenance KPIs in 2026.
Define Clear Objectives and Areas of Focus
Start by identifying what you want to achieve through maintenance KPI tracking. Trying to track everything at once often leads to poor data quality and unclear insights.
Best practices include:
- Define priority focus areas for a specific time period (e.g., downtime reduction or PM compliance)
- Align KPIs with operational and business objectives
- Avoid frequent, major changes to KPI goals
A focused approach ensures consistency and meaningful performance comparisons.
Set Specific, Measurable, and Realistic Targets
KPIs should always include clear benchmarks and timelines rather than vague improvement goals.
Best practices include:
- Replace general goals with measurable targets
- Set ambitious but achievable benchmarks
- Include clear timelines for evaluation
Example: Instead of “Improve work order completion rate,” set “Increase work order completion rate from 70% to 90% by year-end.”
Establish Baselines Before Measuring Progress
Before tracking improvement, establish baseline performance levels to understand where you currently stand.
Best practices include:
- Capture historical maintenance data
- Use baseline metrics as a reference point
- Compare progress consistently over time
Baselines provide context and prevent misinterpretation of KPI results.
Use ERP Systems to Automate Data Collection
Manual data collection increases errors and delays insight generation. A modern ERP system centralizes maintenance, asset, inventory, and labor data.
Best practices include:
- Use ERP dashboards for real-time KPI tracking
- Automate work order, asset, and inventory data capture
- Ensure data accuracy and consistency across departments
ERP-driven tracking improves visibility and reduces reporting effort.
Track Progress Continuously—Not Just at Period-End
Waiting until the end of a quarter or year to review KPIs limits their usefulness.
Best practices include:
- Monitor KPIs regularly through ERP dashboards
- Identify issues early and course-correct quickly
- Use leading indicators to predict future performance
Continuous tracking enables proactive maintenance management.
Analyze and Contextualize KPI Results
KPIs don’t tell the full story on their own—context matters.
Best practices include:
- Analyze trends, not just single data points
- Identify external factors influencing performance
- Review supporting metrics that may explain results
For example, rising downtime may be linked to aging equipment rather than poor technician performance.
Turn Insights into Action
The true value of maintenance KPIs lies in using them to drive improvement.
Best practices include:
- Convert KPI insights into corrective actions
- Adjust maintenance strategies, schedules, or training
- Use KPI data to justify investments in tools, technology, or headcount
KPIs should always lead to measurable operational change.
Communicate KPI Performance Across Teams
Maintenance KPI tracking should be transparent and collaborative.
Best practices include:
- Share KPI results regularly with maintenance and operations teams
- Encourage accountability and cross-team problem-solving
- Align stakeholders around shared performance goals
Clear communication ensures everyone works toward the same outcomes.
Adopt a Continuous Improvement Mindset
KPIs should evolve gradually as business conditions, assets, and strategies change.
Best practices include:
- Review KPIs periodically without frequent overhauls
- Make incremental adjustments to targets and benchmarks
- Use KPI trends to guide long-term maintenance strategy
A continuous improvement mindset ensures KPI tracking remains relevant and effective.
In 2026, successful maintenance KPI tracking depends on focus, clarity, automation, and action. By following these best practices and leveraging ERP systems for real-time visibility, organizations can transform maintenance KPIs into powerful tools for reliability, efficiency, and sustained operational excellence.
How Deskera Manufacturing ERP Can Help You with Maintenance KPIs
Tracking and analyzing maintenance KPIs is only effective if you have accurate, real-time data. Deskera Manufacturing ERP provides a centralized platform that streamlines maintenance management, making it easier to set, monitor, and act on KPIs.
Centralized Maintenance Data
Deskera ERP consolidates all maintenance records, work orders, and asset histories in one place. This centralized system ensures that KPIs—such as MTTR, MTBF, and Preventive Maintenance Compliance—are based on reliable, up-to-date data, eliminating the errors that often arise from manual tracking.
Automated KPI Tracking and Reports
The ERP automatically calculates key maintenance metrics and generates dashboards and reports. You can track equipment uptime, downtime, and maintenance costs in real time, making it easier to spot trends and identify areas for improvement without sifting through spreadsheets.
Preventive Maintenance Scheduling
Deskera ERP helps schedule preventive maintenance based on asset criticality and historical performance. By linking maintenance schedules to KPIs like Schedule Compliance and Preventive Maintenance Completion Rate, organizations can reduce unplanned downtime and improve equipment reliability.
Resource Optimization
ERP systems provide insights into labor, spare parts usage, and maintenance costs. This allows teams to optimize resource allocation and reduce waste, helping improve KPIs such as Maintenance Cost per Asset and Work Order Efficiency.
Trend Analysis and Continuous Improvement
With historical data stored in Deskera ERP, organizations can analyze trends, forecast equipment failures, and proactively adjust maintenance strategies. This continuous improvement loop ensures KPIs evolve with business needs and operations scale efficiently.
Deskera Manufacturing ERP turns maintenance KPI tracking from a manual, reactive process into a data-driven, proactive system, helping operations teams make smarter decisions, extend equipment life, and improve overall operational efficiency.
Key Takeaways
- Maintenance KPIs are quantifiable metrics that track maintenance performance and asset health, enabling organizations to monitor, evaluate, and optimize maintenance operations.
- KPIs focus on critical performance outcomes aligned with business goals, while maintenance metrics track specific operational data; understanding the difference helps prioritize what truly drives improvement.
- Organizing KPIs into categories such as equipment reliability, maintenance efficiency, cost control, and safety ensures a structured approach and makes performance measurement more actionable.
- Tracking key KPIs like MTTR, MTBF, OEE, and work order completion rate helps organizations improve equipment reliability, reduce downtime, and optimize maintenance operations.
- Measuring KPIs enables informed decision-making, increased equipment uptime, operational efficiency, cost savings, and supports a proactive maintenance culture.
- Select KPIs that are measurable, actionable, aligned with organizational objectives, and provide insights to optimize resources and performance.
- Follow a structured approach: set clear goals, track relevant metrics, analyze results, communicate with teams, and continuously refine KPIs for sustained improvement.
- Deskera ERP centralizes maintenance data, automates KPI tracking, supports preventive maintenance, optimizes resource allocation, and provides insights for data-driven decisions, making KPI management efficient and scalable.
Related Articles