
Balance sheet (also known as Statement of Financial Position) is one of the 3 important financial statements. Alongside with Income Statement and Cashflow Statement, it helps to reveal a company's overall financial health.
1 INTRO
Balance sheet (also known as Statement of Financial Position) is one of the 3 important financial statements. Alongside with Income Statement and Cashflow Statement, it helps to reveal a company's overall financial health.
If you are a startup looking for funding or established company business, you have to prepare a Balance Sheet. And if you are an investor or considering lending money to a business, it is critical to be able to read and analyze the balance sheet.
2 WHAT IS A BALANCE SHEET?
Balance sheet offers a snapshot of the financial position of the company at a moment in time.
This snapshot contains:
· Assets: How much the company owns.
· Liabilities: How much the company owes.
· Equity: The amount invested by its owner or shareholders and earnings retained from operation.

The word "balance" in the Balance Sheet implies that the total Assets must be equal to total Liabilities and Equity: Assets=Liabilities+Equity
Think of it this way:
What you have on hand (assets) comprises of:
1/ What you have borrowed from banks or other creditors (liabilities)
2/ What you or shareholders have chipped into the business (Equity).
3 HOW DOES A BALANCE SHEET LOOK LIKE?
The ways a Balance Sheet is prepared differ between companies, but the core structure of it stays unchanged.
Balance Sheet usually shows Asset on one side, and liabilities and equity on the other side
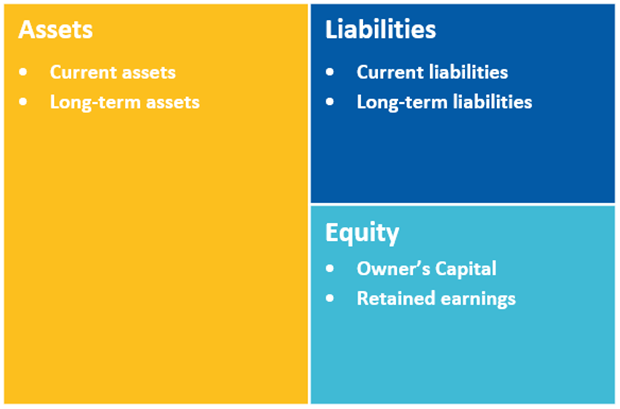
The individual items under each of these sections constitute your Chart of Accounts (COA).
4 REAL-LIFE EXAMPLES OF BALANCE SHEETS
Let's have a look at the Balance Sheet of ALPHABET (Parent of Google) and Apple.
Try to identify the 3 main components of the balance sheets.
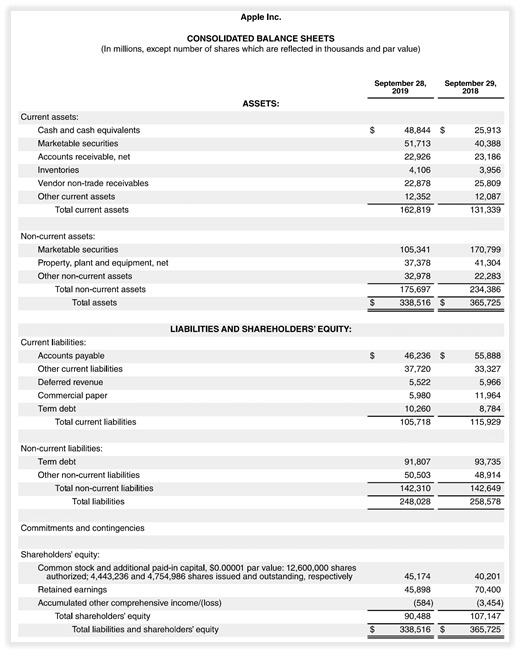
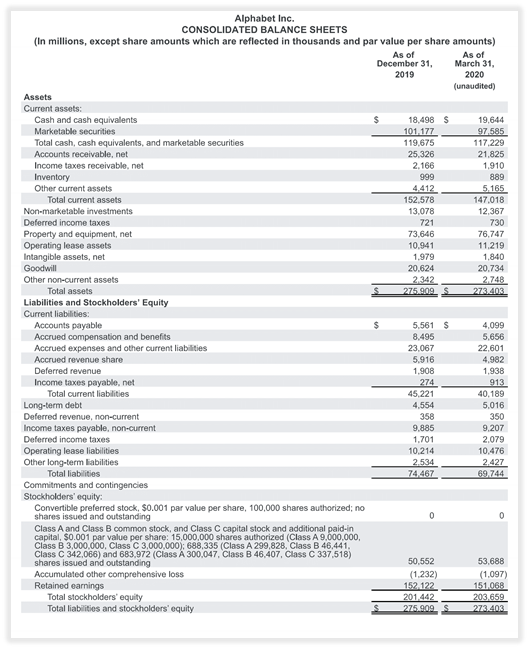

What does the word Consolidated mean on Apple's and Alphabet's Balance Sheets?
Don't forget that Apple and Alphabet are both multi-million dollars international corporations with many subsidiaries. Consolidated means the Balance Sheet of the whole group is presented collectively as a single entity.
5 WHERE CAN I FIND A COMPANY'S BALANCE SHEET
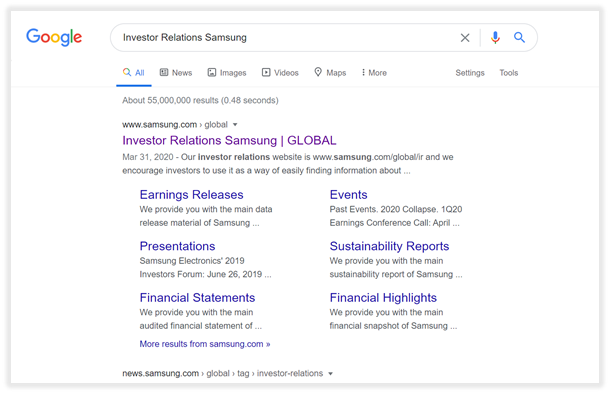
Investor Relations: You can find the Balance Sheet along with other Financial Statements published in the company's Investor Relations. Simply do a quick search on Google.
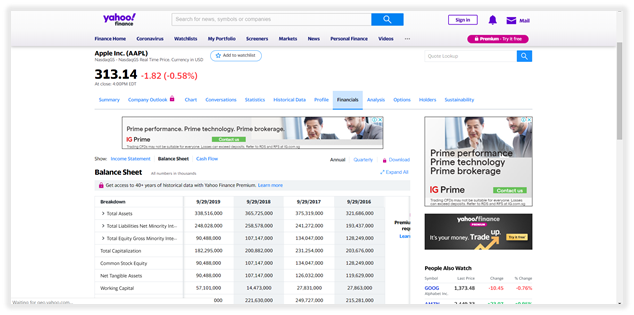
Yahoo finance: Search using the company's name or ticker symbol, then click on the Financial section where all 3 financial statements are located. It is also a great tool to compare figure from different years or quarters.
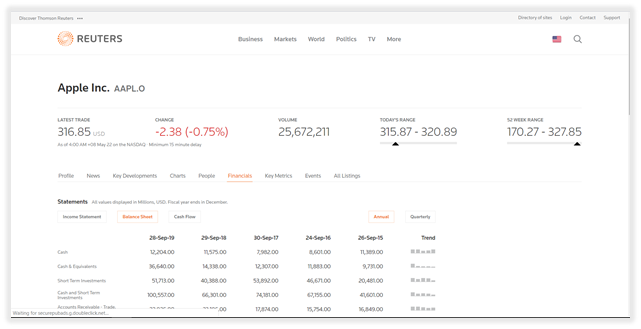
Reuters: Another trusted tool is Reuter. Use the search bar on the top right to find a company.
https://www.reuters.com/finance
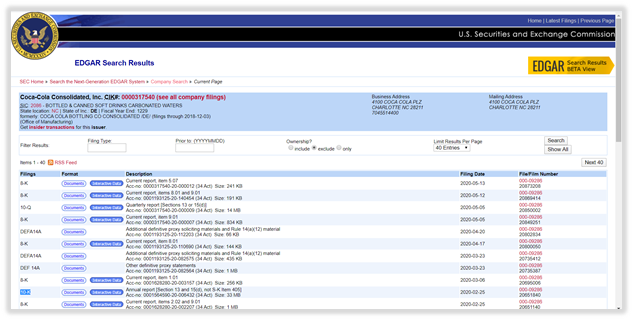
The SEC website: For a publicly traded US company, you can find it in the 10-K (contains annual report) and 10-Q (contains quarterly report) filings on the Securities and Exchange Commission website.
https://www.sec.gov/edgar/searchedgar/companysearch.html
6 HOW TO READ A BALANCE SHEET
ASSETS
Assets are what companies own to generate income such as factory, furniture, goods for sale, money in bank accounts.
Assets are broken down into 2 main categories:
· Current Assets (or short-term assets)
· Non-current Assets (long-term assets)
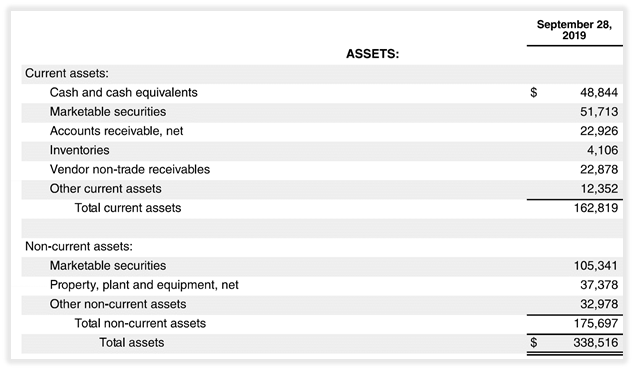
Current Assets
Short-term assets that can be converted to cash within a year, which is crucial during financial emergencies when companies need cash the most.
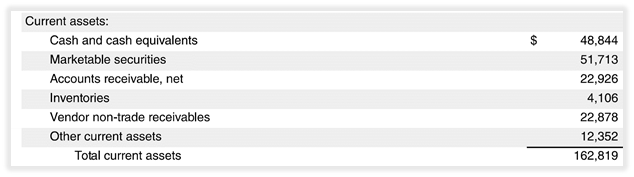
Cash and Cash Equivalents
Cash refers to cash on hands or in your checking or saving accounts, checks received but not deposited.
Cash Equivalents are highly liquid investments with maturity less than a year, such as Banker's acceptance, Commercial paper, Treasury bills, Short-term government bonds, Money Market funds, certain Marketable securities.
Marketables Securities
Short-term liquid financial instruments that can be bought or sold on public stock or bond.
Some example includes stocks, bonds with maturity less than a year, ETFs.
Account Receivables
Amount customers owe your business in exchange for goods and services provided.
Vendor non-trade Receivable
Amounts an entity owe your business, but not for the exchange of goods and services provided. For example, tax refund the government owes to your business
Inventory
Total value of goods available for sales or any raw materials used to produce finished goods.
Prepaid expenses
Expenses incurred in the future that have been paid in advance such as Prepaid Rental, Prepaid Insurance Premium, etc.
Non-Current Assets (Long-term assets)
Long-term assets used in operation to generate profit
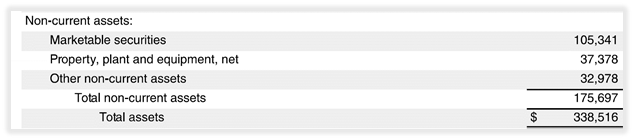
Property, plant and equipment (PP&E)
Also known as fixed assets. Long-term assets with a lifetime of more than a year are put under this section.
For example, Delivery vehicles, Office furniture, buildings, factories, lands.
Note that if you buy computers to resell, that is an Inventories. But if you buy the same computers for your office's use, they are now PPE.
Long-term Investments
Any Long-term investments is nested under this section, like stocks, bonds with maturity more than a year, real estate.
Note that in Apple's Balance Sheet, Marketable Securities appear in both Current and Non-current Assets. So Apple holds both long-term and short-term Marketable Securities

Why is there a "net" next to Property, plant and equipment? On Apple's Balance Sheet?
When dealing with Property, plant and equipment, we have to record how much the value of PPEs have depreciated over time. You can either:
· Show the original value of PPEs, then add a line for "Less accumulated depreciation," then a PPE, net line.
· Only show one line for the net amount.
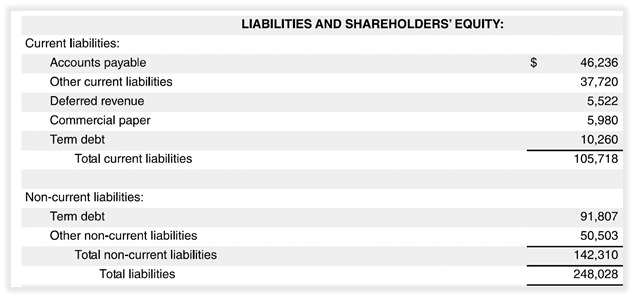
LIABILITIES
Liabilities are what companies owe, including loans from banks, money owes to vendors, employees, tax authorities.
Liabilities are broken down into 2 main categories:
· Current Liabilities (short-term liabilities)
· Non-current Liabilities (long-term liabilities)
Current Liabilities
Company's obligations that need to be settled within a year or less
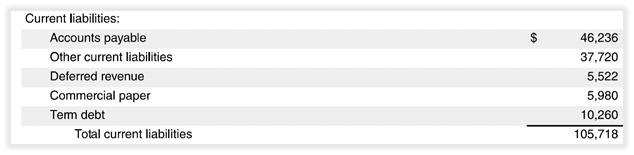
Accounts Payable
Amount your business owe in exchange for goods and services provided by vendors and service providers.
Deferred Revenue (Unearned Revenue)
Money Received from customers for services or goods that have yet to be delivered.
When the goods or services are fully delivered to the customers, the amount will be removed from Deferred Revenue and transferred to Sales account
Dividends Payables
Dividends owe to stockholders
Salaries Payable
Salaries payable to employees
Taxes Payables
Taxes owe to Tax Authorities
Interest Payables
Interest that needed to be paid
Short-term Debt
The portion of the loan that is due within one year

What is that Commercial Paper on Apple's balance sheet?
It is a short-term unsecured debt issued by a corporation to raised funds, usually sold on a discount basis.
For example, you bought a CP with a maturity of 6 months at $980. The CP's face value is $1000. After 6 months, you can then redeem the CP and receive the full-face value $1000.
Non-current Liabilities (Long-term Liabilities)
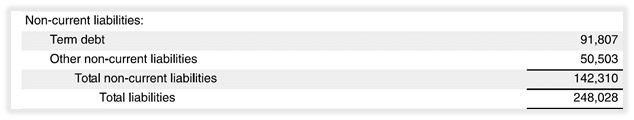
Long-term Debt
The portion of the loan that is due in more than a year
Bonds
Long-term debt issued directly by your company that is purchased by an investor.
What makes this different than stock is that bonds do not entitle investors to any ownership of the company.
For example, to finance a new project, your can company issues 5-year bonds to investors. Over the next 6 years, you must pay back interest on the bonds and the full-face value when the bonds mature to investors.
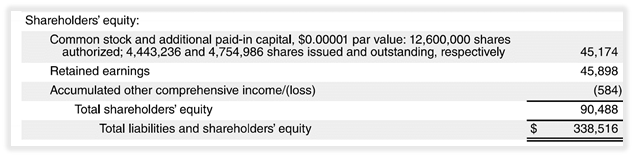
EQUITY
Equity is the difference between total assets and total liabilities, implying the remaining portion of owners or shareholders of the company if all assets are liquidated, and all liabilities are satisfied.
The important sources of Shareholders' Equity are Retained Earning, fund initially invested in the company by the owner, invested amount via issuing stocks.
Owner's Capital
· For proprietorship, Owner's Capital shows the owner's stake in the company.
· For Partnerships, the account is called "Members' Capital" instead.
· For Corporation, the ownership of the company is recorded using the "Common Stock." account, referring to stocks issued by the company held by shareholders.
Retained Earnings
The portion of the Net Income retained to reinvest back into the company after paying dividends to investors (if any).
This account acts as the link from the Income Statement to the Balance Sheet.

What is that Accumulated other comprehensive income/(loss) on Apple's Balance Sheet?
Apple is a US Company; hence it follows GAAP standard (an accounting standard administered by US Securities and Exchange Commission)
Under GAAP, financial activities that do not impact Net Income should be accumulated under Other Comprehensive Income (OCI) in the Balance Sheet, separated from Retained Earnings.
Some of those activities include unrealized gains and losses of foreign currency translation or revaluation of a pension plan or investment. Unrealized means the value has changed, but the real transaction has yet occurred.
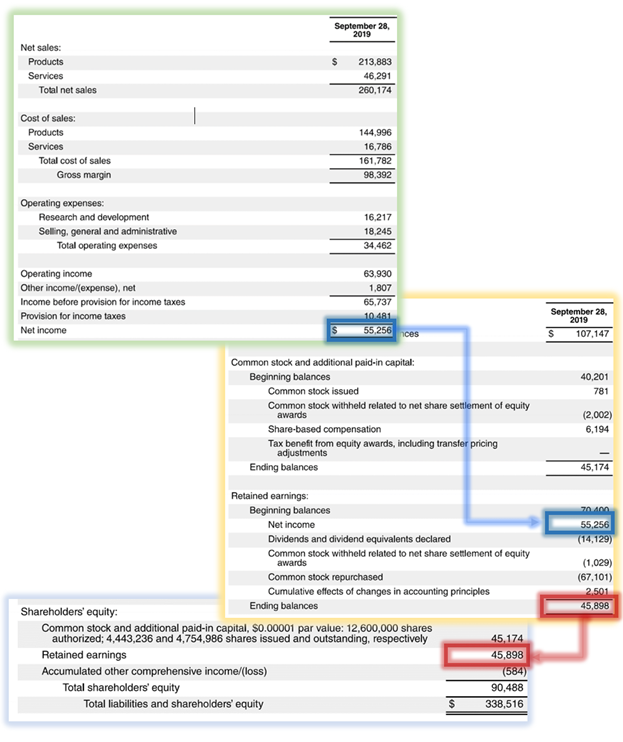
7 HOW BALANCE SHEET AND INCOME STATEMENT ARE RELATED?
Balance Sheet and Income Statement are linked together via:
· Net Income on Income Statement.
· Retained Earnings on Balance Sheet
Net income is feed to Retained Earnings at the end of each reporting period using the formula:
Retained Earnings (RE) = Beginning Balance of RE + Net income – Dividends paid out
For small and medium size businesses that Retained 100% of their Net Income. In this case, Retained Earnings for the period increase simply by Net Income

For a better understanding of this mechanism, let's look at Apple's financial statement. We will need the following information
· Net Income on Income Statement
· Retained Earnings on Statement of Shareholders' Equity
8 WHAT IS VERTICAL ANALYSIS OF BALANCE SHEET?
In Vertical Analysis, each line item is expressed as a percentage of a total amount. The result is called a common-size balance sheet.
Vertical Analysis make comparison between different companies or industry average easier.
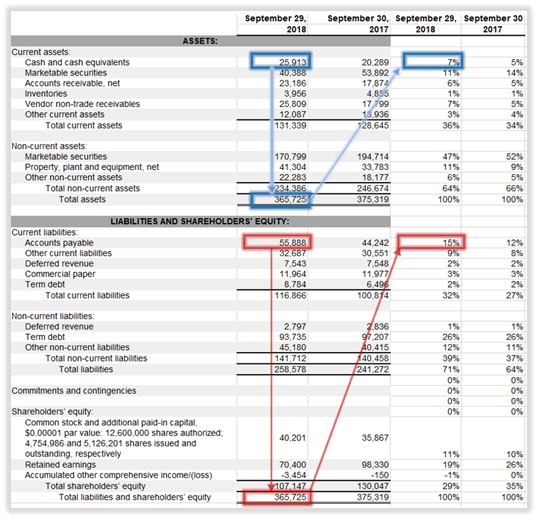
The above example is from Apple’s Balance Sheet. From 2017 to 2018, we could see the company is quite stable, with no major increase or decrease in any components.
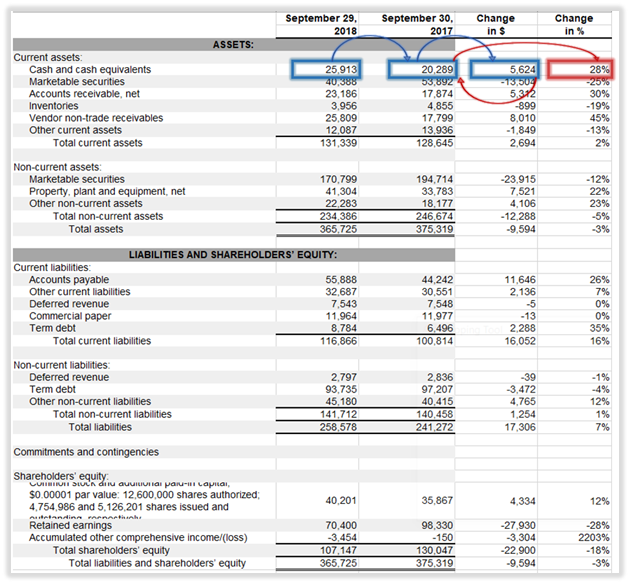
9 WHAT IS HORIZONTAL ANALYSIS OF BALANCE SHEET?
Horizontal Analysis, also called Trend Analysis, shows changes in percentage of the amount on from one year to that a base year.
It is used to compare the result of one year to another year, identify the trend and base on that to forecast the future.
The conversion can be simply put into a single formula:
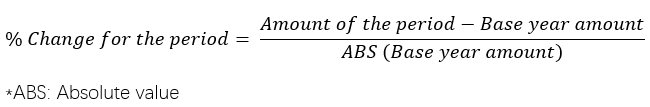

Be careful with Horizontal Analysis, the result of the current period might be manipulated to looks better if a period with poorest results is selected as the base year.
10 ANALYZE THE BALANCE SHEET USING FINANCIAL RATIOS?
Let’s look at 4 useful metrics used in Balance Sheet.
CURRENT RATIO (CR)
To find out whether the company can pay its short-term debts (due in 1 year or less).
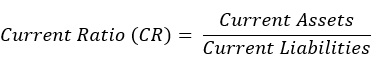
Generally, a higher Current Ratio means higher liquidity and is preferred.
QUICK RATIO (QR)
To find out whether the company can pay its short-term debts (due in 1 year or less).

Quick ratio (acid-test ratio) is similar to Current Ratio, but it only concerns the most liquid assets on the Balance Sheet that can be converted to cash within 90 days or less and eliminate less liquid assets, such as Inventory.
Quick Ratio is more conservative when measuring the company's liquidity.

Generally, a Current Ratio and Quick Ratio of 2:1 or better is generally consider healthy, but always compare any ratios with the Industry Average for an accurate analysis
DEBT RATIO
To find out if the company has more debt than assets?
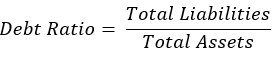
This reveals how much of the company’s assets is finance by Debt
DEBT-TO-EQUITY RATIO (D/E)
To find out if the company has more debt than equity
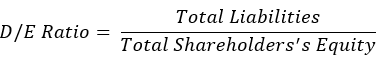
This reveals the weight of equity and debt a business use to finance its assets. (also known as the capital structure of a company)
The preferred range is 1 to 1,5 for Debt-Equity Ratio. The higher Debt Ratio and Debt-to-Equity ratio, the riskier the business is.
Again, it is crucial to compare all ratio to their respective industries average.

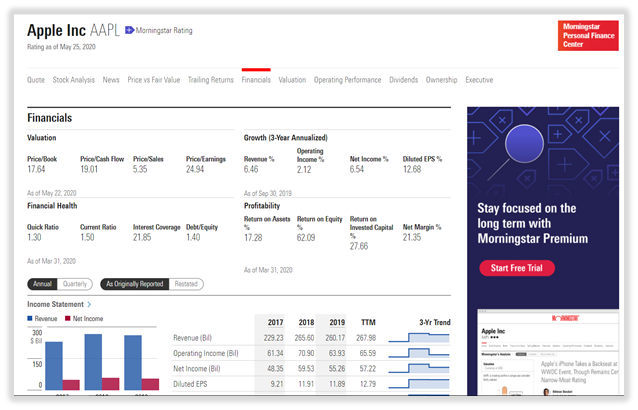
Try morningstar.com for a quick look on a company’s finance, with details on financial ratios.
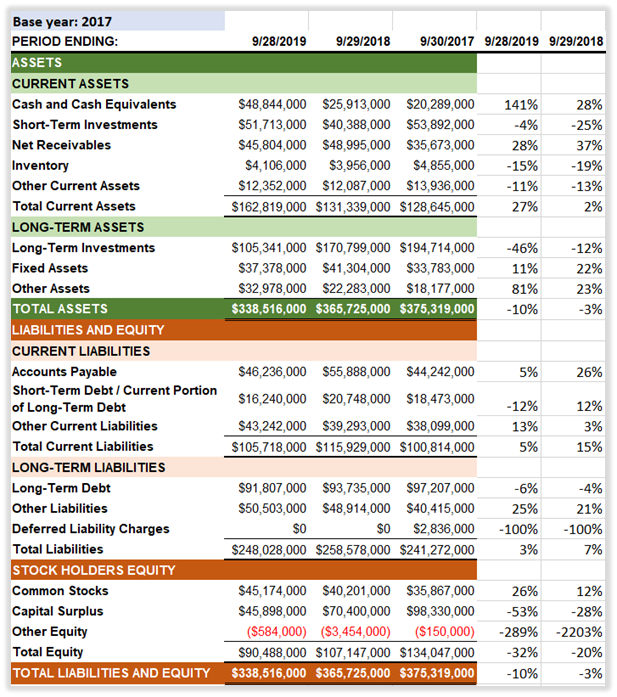
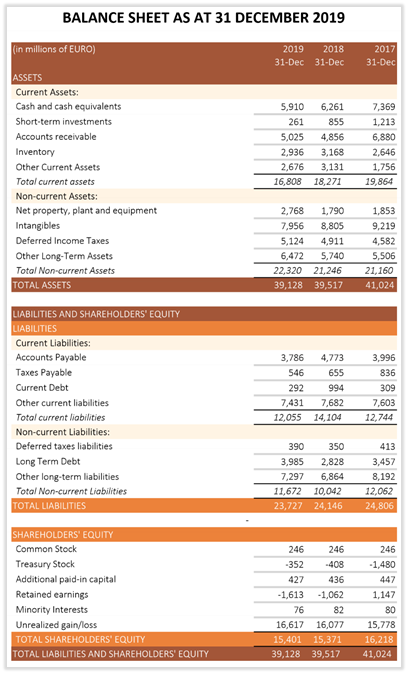
11 A GLANCE AT NOKIA’S BALANCE SHEET
Let’s look at Nokia’s Balance Sheet and try to identify its current financial position. We have also provided a sample analysis based on Nokia’s balance sheet on the next page.
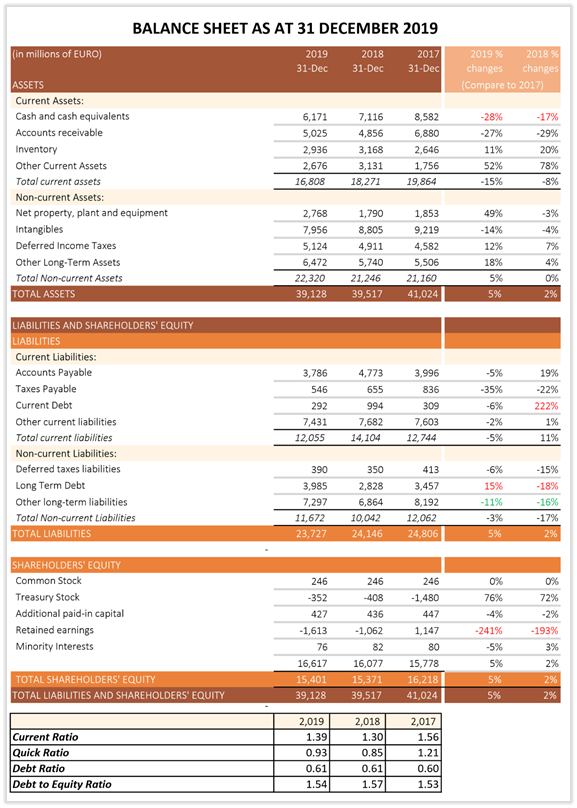
The horizontal analysis points out some red flags of company’s financial position:
· Decrease in Cash in both 2018 and 2019 (compared to 2017)
· Significant increase in Current Debt in 2018
· Consecutive decrease in already negative Retained Earnings in both 2018 and 2019 (signify Nokia incurs more loss)
For ratio analysis. With a Current Assets of 1.39x of Current Liabilities, we have reasons to believe that Nokia can satisfy its Short-Term Liabilities.
(Noted that industry average of Current and Quick Ratio for Communication Sector as of 2019 is 0.90 and 0.74)
Nokia’s debt structure is quite stable in the last 3 years, with 60% of the business financed with debt (Industry average is 57% for 2019), hinting its prudent approach toward Debt Financing. Its Debt-to-Equity ratio is, however, higher than industry average of 1.24, but still in acceptable range.
12 CONCLUSION
You have reached the end of the document. Congratulations!
We hope by now you are ready to read and analyze balance sheet easily.
Although Balance Sheet is important to understand the financial position of a company, remember that it is just one piece of the puzzle.
We suggest reading our articles on Cashflow Statement and Income Statement to fully understand the Trio and how they talk to each other.
If you’re still not sure accounting is for you, Deskera will make it easy for you with our simple online accounting software.