

Is strong revenue always a sign of a healthy business? Not necessarily. While revenue shows how much a company earns, it doesn’t reveal how much it actually keeps. Many businesses experience rising sales yet struggle with shrinking profits—and this gap is exactly where margin analysis becomes critical.
Margin analysis goes beyond topline numbers to uncover the true drivers of profitability. By examining how costs, pricing, and operational efficiency interact, businesses can understand whether growth is sustainable or simply masking inefficiencies. It helps leaders answer tougher questions: Which products are truly profitable? Where are costs eroding value? And how can margins be protected as the business scales?
In today’s competitive environment, margin analysis is no longer just an accounting exercise—it’s a strategic tool. Companies use it to refine pricing strategies, control costs, evaluate product and customer performance, and make informed decisions that directly impact long-term financial health. Without a clear view of margins, businesses risk chasing revenue at the expense of profitability.
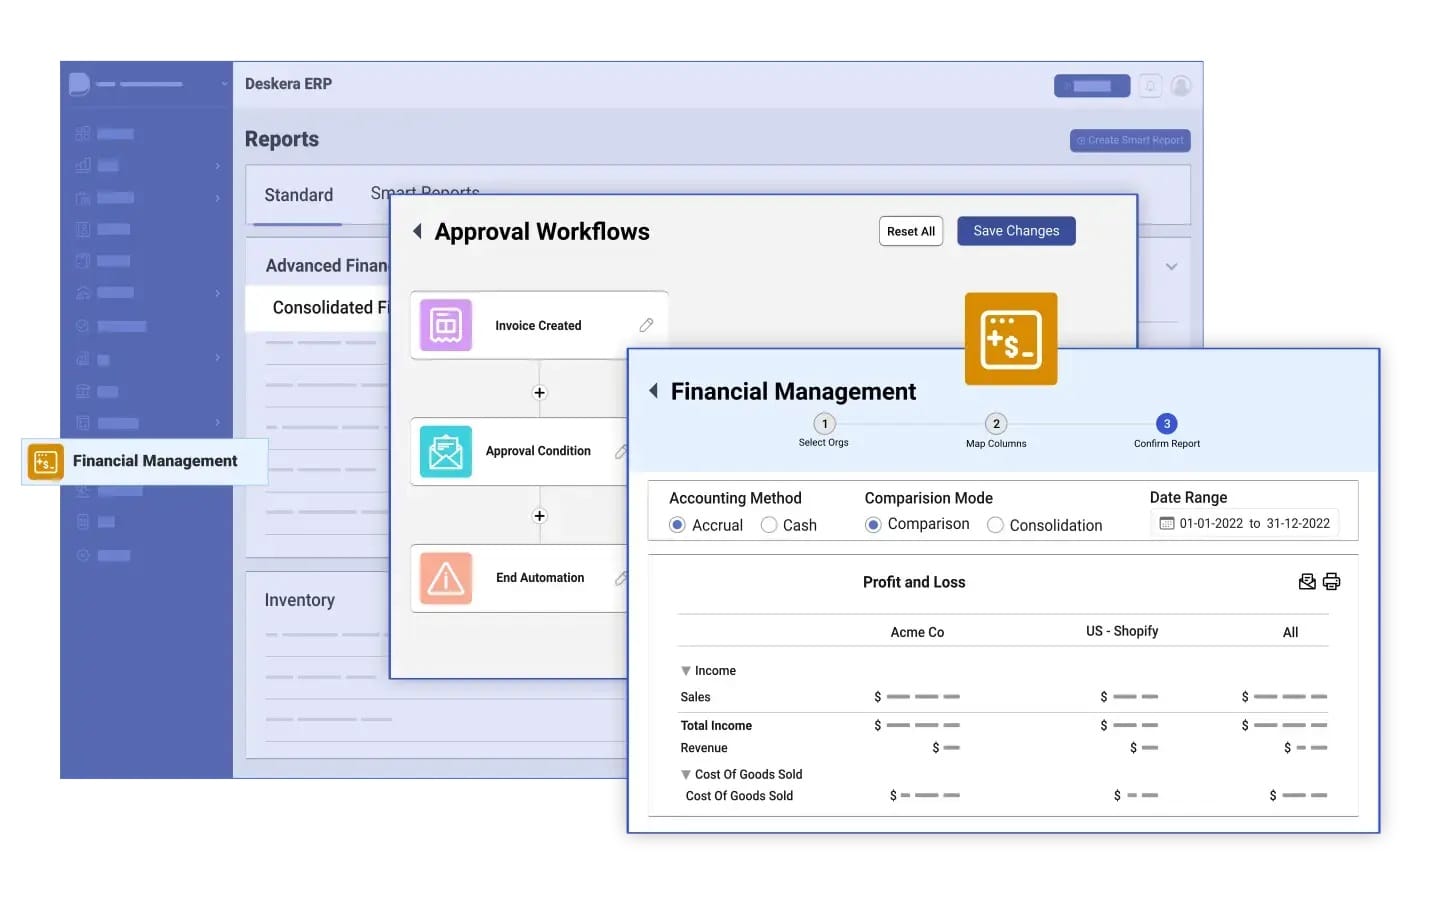
This is where modern ERP systems play a vital role. Solutions like Deskera ERP help businesses automate margin tracking by integrating financial, operational, and inventory data in one platform. Deskera ERP enables real-time visibility into costs and profitability, simplifies margin reporting across products and customers, and supports data-driven decisions—helping businesses shift their focus from just growing revenue to achieving profitable, sustainable growth.
What Is Margin Analysis?
Margin analysis is the process of assessing profit margins to understand how efficiently a business converts revenue into profit after accounting for its costs. In simple terms, it measures the financial cushion between what a company earns and what it spends.
Rather than focusing on absolute profit figures, margin analysis expresses profitability as a percentage of revenue—showing how many cents of every sales dollar a business actually keeps. This makes it far more effective for comparing performance across time periods, products, or even businesses of different sizes.
At its core, margin analysis helps evaluate the profitability of a business, product, or service by examining the difference between the selling price and the cost of goods sold (COGS). This difference, calculated as a percentage, is known as the margin.
When businesses clearly understand their margins, they can identify which areas are driving profitability, where costs are eroding value, and what needs improvement to strengthen overall financial performance. It is a critical tool for cost management, pricing decisions, and long-term profitability planning.
Margin analysis also serves as a measure of operational efficiency. It answers important strategic questions such as: How effectively does the business turn revenue into profit? Where are profits leaking due to rising costs or inefficiencies?
How does current performance compare with past results or industry benchmarks? Unlike profit measured in absolute terms, margin analysis provides context—allowing businesses to spot trends, compare against competitors, and understand performance beyond raw revenue growth.
As a form of financial statement analysis, margin analysis follows the structure of the income statement, evaluating profitability at successive stages. It begins with gross margin, which reflects profitability after direct production or service delivery costs.
Operating margin then accounts for operating expenses such as administration and overheads. Finally, net margin shows what remains after all expenses, taxes, interest, and non-operating items are considered. Analyzing these margins together offers a complete picture of where profits are generated—and where they quietly slip away.
Importantly, margin analysis can be applied at multiple levels: across the entire business, by department, product line, customer segment, or even individual SKUs.
While a single margin calculation has limited value, tracking margins over time, benchmarking them against industry peers, and comparing actual results with budgets or forecasts unlocks its real power. This deeper, more granular view helps businesses move beyond “we made money” to understanding how and where they truly make it.
Objectives of Margin Analysis
Margin analysis is more than a financial calculation—it is a decision-support tool that translates financial data into actionable business insights. By linking profitability metrics with operational activities, margin analysis helps leadership teams objectively evaluate performance, prioritize initiatives, and align day-to-day decisions with long-term business goals.
The following objectives highlight how margin analysis supports smarter, more profitable management.
Cost Control and Expense Visibility
One of the primary objectives of margin analysis is to identify where costs are consuming a disproportionate share of revenue. By isolating costs at the production, operational, and total business levels, margin analysis brings clarity to spending patterns and highlights areas of inefficiency.
This is especially valuable for tracking indirect or shared costs—such as overheads and administrative expenses—that are often harder to attribute but can significantly erode profitability if left unchecked.
Pricing Strategy Optimization
Margin analysis plays a critical role in evaluating whether current pricing supports the organization’s profitability targets. It helps businesses understand the impact of discounts, promotions, and competitive pressures on margins, rather than just on sales volume.
With clear margin insights, companies can refine pricing strategies to protect profitability—an area where even small improvements can have a meaningful bottom-line impact.
Performance Measurement and Management
Another key objective of margin analysis is to provide clear benchmarks for assessing operational efficiency.
By tracking margins across products, departments, or business units, organizations can determine whether performance is improving, stagnating, or declining.
This enables objective evaluation of management effectiveness and ensures accountability by linking operational outcomes directly to financial results.
Effective Resource Allocation
Margin analysis helps businesses allocate time, capital, and workforce resources more effectively by revealing which activities generate the highest returns. It highlights profitable operations that deserve further investment while flagging underperforming areas that require closer investigation. This insight ensures that resources are not spread evenly, but strategically deployed where they deliver the greatest value.
Informed Strategic Planning and Growth Decisions
At a strategic level, margin analysis provides the data foundation for major business decisions. It helps leaders evaluate product portfolios, determine which offerings to scale or phase out, and assess market expansion or contraction opportunities.
Margin analysis is also essential when considering strategic initiatives such as acquisitions, restructuring, or entering new markets, as it quantifies the potential impact on overall financial performance and supports confident, data-driven decision-making.
Types of Margin Analysis
Margin analysis can be conducted in several ways, with each type offering a different lens on profitability. Together, these margins help businesses understand how profits are generated at various stages of operations—from production and daily activities to overall financial performance.
Among the many metrics available, gross margin, operating margin, and net margin form the foundation of margin analysis and are most widely used for evaluating business health.
Gross Profit Margin Analysis
Gross profit margin measures the percentage of revenue remaining after deducting the cost of goods sold (COGS), which includes direct costs such as raw materials, direct labor, and production-related expenses. It reflects how efficiently a business produces goods or delivers services relative to its revenue.
Formula: (Revenue − COGS) / Revenue × 100
A strong gross margin indicates effective pricing and cost control at the production level, while a declining margin may signal rising input costs, inefficiencies, or pricing pressures. Gross margin analysis is particularly useful for identifying the most profitable products, services, or markets and evaluating sourcing and production strategies.
Operating Margin Analysis
Operating margin examines profitability after accounting for operating expenses such as salaries, rent, utilities, marketing, and administrative costs. It focuses on earnings generated from core business operations, excluding taxes and interest.
Formula: Operating Income / Revenue × 100
This margin highlights how well a company manages its day-to-day operations. A high operating margin suggests strong operational efficiency and disciplined cost management, whereas a low margin may indicate bloated overheads or insufficient pricing. Operating margin analysis is a key indicator of a business’s financial stability and scalability.
Net Profit Margin Analysis
Net profit margin represents the percentage of revenue that remains after all expenses—including operating costs, taxes, and interest—have been deducted. It provides the most comprehensive view of a company’s profitability.
Formula: Net Income / Revenue × 100
Net margin analysis shows how effectively a business converts revenue into actual profit. A healthy net margin reflects balanced pricing, cost control, and financial structure, while a low margin may point to high debt, excessive costs, or structural inefficiencies. Because it captures every factor affecting profitability, net margin is essential for long-term planning and strategic decision-making.
Contribution Margin Analysis
Contribution margin analysis focuses on the profitability of individual products or services by measuring the difference between sales revenue and variable costs. This margin is critical for break-even analysis, pricing decisions, and product mix optimization.
By understanding contribution margins, businesses can determine which offerings contribute most to covering fixed costs and generating profit, and which ones may be underperforming despite strong sales volumes.
Segment Margin Analysis
Segment margin analysis evaluates profitability across different business units, product lines, regions, or customer segments. It helps organizations identify where profits are truly generated and where resources may be underutilized or misallocated.
This type of analysis supports more targeted decision-making, such as expanding high-performing segments or restructuring underperforming ones.
Cash Flow and EBITDA Margin Analysis
Cash flow margin analysis assesses the relationship between operating cash flow and revenue, offering insight into a company’s ability to generate cash from its operations. EBITDA margin analysis, on the other hand, evaluates earnings before interest, taxes, depreciation, and amortization as a percentage of revenue.
These margins are particularly useful for comparing companies with different capital structures or tax environments and for understanding financial performance beyond accounting profits.
Together, these types of margin analysis provide a layered understanding of profitability. While gross margin reveals production efficiency, operating margin reflects operational discipline, and net margin confirms overall financial health, the additional margin metrics add depth—helping businesses pinpoint exactly where value is created and where it is lost.
Process of Margin Analysis
Margin analysis follows a structured, repeatable process that turns financial data into meaningful business insights. While the calculations themselves are straightforward, the real value lies in how systematically margins are analyzed, compared, and acted upon.
Below is a step-by-step process businesses can follow to conduct effective margin analysis.
Step 1: Start With Accurate and Well-Defined Data
The foundation of margin analysis is clean, reliable financial data. Begin by gathering detailed information on revenue, cost of goods sold (COGS), operating expenses, interest, taxes, and net income—typically from the income statement.
For deeper insights, break this data down by products, customer segments, regions, or business units. Accurate classification of costs (direct vs. indirect, fixed vs. variable) is critical, as errors at this stage can distort all subsequent analysis.
Step 2: Calculate Key Profit Margins
Once the data is organized, calculate the relevant margins based on your objective. This usually includes gross margin, operating margin, and net margin.
- Use gross margin to assess production or service delivery efficiency.
- Use operating margin to evaluate the profitability of core business operations.
- Use net margin to understand overall financial performance after all expenses.
Consistency is essential—use the same formulas and methods across periods and segments to ensure meaningful comparisons.
Step 3: Track Changes and Identify Trends
A single margin figure offers limited insight. The real value emerges when margins are tracked over time. Compare current margins with historical data to identify trends such as declining gross margins or stagnant net margins.
Sudden shifts often signal underlying issues like rising costs, pricing pressure, or operational inefficiencies. Dashboards and visual tools can help spot patterns and relationships quickly.
Step 4: Analyze Margins by Segment
Not all parts of a business perform equally. Breaking margins down by product, customer group, or region reveals where profits are actually generated. This segmentation helps identify high-performing areas to scale and underperforming ones that may require pricing changes, cost reduction, or strategic realignment. Segment-level analysis is especially useful for targeted decision-making and resource prioritization.
Step 5: Identify the Key Drivers Behind Margins
Margins are primarily influenced by three factors: pricing, costs, and sales volume. At this stage, analyze what is driving margin performance. Rising input costs may be compressing gross margins, excessive overheads may be affecting operating margins, or low-margin, high-volume products may be dragging down net profitability. Understanding these drivers allows businesses to pinpoint root causes rather than treating symptoms.
Step 6: Test Scenarios and Evaluate Impact
Before taking action, simulate different scenarios to understand their potential impact on margins. For example, test how a price increase, cost reduction, or change in sales mix would affect profitability.
Scenario analysis helps businesses evaluate trade-offs and choose actions with the highest potential return while minimizing risk.
Step 7: Act on Insights and Monitor Continuously
Margin analysis is only valuable if it leads to action. Use insights to refine pricing strategies, control costs, reallocate resources, or adjust growth plans. After implementing changes, continue to monitor margins regularly—quarterly at a minimum—to ensure improvements are sustained. As market conditions, supplier pricing, and customer behavior change, ongoing margin analysis helps businesses stay agile and profitable.
By following this structured process, organizations can move beyond surface-level profitability metrics and use margin analysis as a continuous tool for financial discipline, strategic clarity, and long-term growth.
Benefits of Margin Analysis
Margin analysis delivers far more than profitability ratios—it provides actionable insight into how a business earns, spends, and grows. By examining margins at different levels, organizations gain clarity on financial performance, operational efficiency, and strategic priorities.
Below are the key benefits of margin analysis and how they support smarter business decisions.
Improved Understanding of Profitability
Margin analysis helps businesses determine whether they are generating enough profit to cover costs and support growth. A low gross or net margin can quickly reveal issues with pricing, supplier costs, or cost structures that may not be obvious from revenue figures alone. This clarity allows leaders to assess true financial health rather than relying on topline performance.
Identification of Cost Inefficiencies
One of the most practical benefits of margin analysis is its ability to highlight where expenses are eroding profits. By breaking costs down across production, operations, and the overall business, margin analysis makes it easier to spot inefficiencies such as excessive overheads, rising input costs, or underperforming processes. This insight creates a strong foundation for targeted cost-reduction initiatives.
Better Pricing Decisions
Margins play a central role in pricing strategy. Margin analysis helps businesses evaluate whether current pricing reflects their value proposition and covers all associated costs. If margins fall below industry benchmarks, it may signal the need to revise pricing models, discount strategies, or product positioning to remain competitive without sacrificing profitability.
Clear Visibility into Profitable Products and Services
By applying margin analysis at a product or service level, businesses can identify which offerings contribute the most to profitability and which ones underperform. This enables informed decisions around product mix, promotions, and marketing focus—ensuring that resources are directed toward high-margin, high-value offerings rather than purely high-volume ones.
Stronger Strategic Decision-Making
Margin analysis supports a wide range of strategic decisions, from selecting the right markets and locations to determining which products to scale, maintain, or discontinue. By understanding how different costs affect overall profitability, businesses can make data-backed decisions around pricing, sourcing, marketing spend, and expansion strategies with greater confidence.
Effective Cost Reduction Opportunities
A detailed margin breakdown reveals exactly where costs are too high and where corrective action is needed. Whether it involves negotiating better supplier terms, optimizing production processes, or reducing operational expenses, margin analysis helps prioritize cost-saving efforts based on their potential impact on profitability.
Improved Resource Allocation
Margin analysis enables smarter allocation of time, capital, and talent by highlighting which activities deliver the highest returns. Businesses can prioritize investments in high-margin products or services while reassessing lower-margin offerings. When combined with sales volume data, this insight helps balance profitability with revenue growth opportunities.
Enhanced Performance Monitoring and Competitive Advantage
Regular margin analysis allows organizations to track performance trends over time and take corrective action before issues escalate. It also provides a benchmark for comparing performance against competitors, helping businesses strengthen their market position. Additionally, margin insights support transparent communication with stakeholders by clearly explaining what drives profitability and where improvements are underway.
Overall, margin analysis equips businesses with the insight needed to focus resources where they matter most—transforming financial data into a powerful tool for sustained profitability and competitive growth.
Common Challenges in Margin Analysis
While margin analysis is a powerful tool for understanding profitability, it is not without challenges. Inaccurate data, narrow perspectives, or misinterpretation of results can lead to flawed conclusions and poor decisions.
Recognizing these common challenges helps businesses apply margin analysis more effectively and avoid costly mistakes.
Incomplete Cost Allocation
One of the most frequent challenges in margin analysis is failing to account for all relevant costs. Businesses often focus heavily on direct costs such as raw materials or direct labor while overlooking overhead expenses like salaries, utilities, rent, or shared administrative costs. This results in overstated margins and an inaccurate picture of profitability.
How to address it: Ensure that all relevant costs are included and properly classified. A consistent approach to cost allocation—especially for indirect expenses—provides a more realistic and reliable margin analysis.
Overreacting to Short-Term Fluctuations
Margins naturally fluctuate due to seasonality, market conditions, or temporary cost changes. Reacting too quickly to a single weak quarter by cutting costs or changing prices can lead to long-term damage, such as reduced quality or customer dissatisfaction.
How to address it: Focus on margin trends over multiple periods rather than isolated results. Long-term patterns offer more meaningful insight than short-term variations and support more balanced decision-making.
Misuse of Industry Benchmarks
Comparing margins with industry averages can be helpful, but it can also be misleading if businesses have different product mixes, customer segments, or cost structures. Blindly chasing benchmark figures may push organizations toward strategies that do not align with their unique business model.
How to address it: Use benchmarks as reference points, not targets. Place greater emphasis on internal comparisons over time and evaluate margins in the context of your specific operating environment.
Lack of Segment-Level Analysis
Relying only on overall business margins can hide underperforming products, regions, or customers. High-performing segments may mask losses elsewhere, leading to poor resource allocation and missed improvement opportunities.
How to address it: Break down margins by product, customer, geography, or business unit. Segment-level analysis reveals where profitability is truly generated and where corrective action or additional investment is needed.
Data Quality and Consistency Issues
Margin analysis depends on accurate, consistent financial data. Errors in revenue recognition, inconsistent cost classification, or manual data handling can distort margins and reduce confidence in the results.
How to address it: Standardize financial reporting processes and use reliable systems to capture and maintain clean data. Consistency across periods and segments is essential for meaningful analysis.
By addressing these challenges proactively, businesses can ensure that margin analysis remains a dependable tool—one that supports sound decisions, highlights real opportunities, and drives sustainable profitability rather than reactive or misleading conclusions.
Tips for Avoiding Common Margin Analysis Mistakes
Margin analysis can deliver powerful insights, but only when it is done with care, consistency, and context. Many errors arise not from the calculations themselves, but from flawed assumptions, inconsistent data treatment, or narrow interpretation.
The following tips help ensure margin analysis remains accurate, reliable, and decision-ready.
Maintain Consistent Cost Classification
One of the most common mistakes in margin analysis is misclassifying costs. When an expense is treated as COGS in one period and as an operating expense in another, margin trends become unreliable and misleading.
Tip: Establish clear cost classification rules and apply them consistently across periods. Document how each expense category is treated so margin comparisons remain valid over time.
Account for All Relevant Costs
Focusing only on direct costs such as raw materials or direct labor can significantly inflate gross margins. Indirect costs—like manufacturing overhead, utilities, rent, and shared services—are often overlooked but materially impact profitability.
Tip: Ensure indirect and shared costs are properly allocated to products, services, or segments. A more complete cost picture leads to more realistic margin insights.
Analyze Trends, Not Isolated Results
Relying on a single quarter or a single margin metric can result in poor decisions. Short-term fluctuations caused by seasonality, promotions, or one-time expenses may distort conclusions.
Tip: Review margins across multiple periods and analyze gross, operating, and net margins together. Trend analysis provides a more accurate view of underlying performance than point-in-time results.
Use Benchmarks Carefully
Industry benchmarks can be useful, but they are often misapplied. Differences in business models, customer mix, or cost structures can make direct comparisons misleading.
Tip: Use benchmarks as contextual references rather than strict targets. Prioritize internal comparisons over time and focus on improving your own margin trajectory.
Incorporate External Factors into Interpretation
Margins do not exist in isolation. Macroeconomic conditions, supply chain disruptions, regulatory changes, and competitive pressures can all influence margin performance.
Tip: Always interpret margin results in light of external conditions. Understanding why margins changed is just as important as recognizing that they did.
Perform Segment-Level Analysis
Looking only at overall margins may hide underperforming products, customers, or regions. High-margin areas can mask losses elsewhere, leading to poor resource allocation.
Tip: Break margins down by product line, customer group, or geography to uncover hidden issues and opportunities.
Validate Data Accuracy Before Analysis
Even the best analysis fails if the underlying data is inaccurate or incomplete. Manual data entry, inconsistent reporting, or outdated information can skew results.
Tip: Regularly audit financial data and standardize reporting processes. Reliable data is the foundation of meaningful margin analysis.
By following these best practices, businesses can avoid common margin analysis mistakes and ensure their insights are grounded in accurate data, thoughtful interpretation, and strategic context—turning margin analysis into a dependable tool for sustainable profitability.
How Deskera ERP Can Help With Margin Analysis
Margin analysis depends on accurate data, timely reporting, and the ability to drill into details across products, customers, and operations. Deskera ERP is designed to integrate financials, inventory, sales, and operations into a single platform—making margin analysis easier, faster, and more reliable.
Here’s how Deskera ERP can support your margin analysis efforts:
1. Centralized and Real-Time Financial Data
Margin analysis starts with reliable financial figures. Deskera ERP consolidates revenue, costs, and expense data from across the business in a centralized system. This means your margin calculations are based on up-to-date numbers rather than outdated spreadsheets. Real-time financial reporting helps you monitor changes in gross, operating, and net margins as they happen.
2. Automated Calculation of Key Margins
Deskera ERP can automatically compute important margin metrics—such as gross profit margin, operating margin, and net profit margin—based on system data. By pulling cost of goods sold (COGS), operating expenses, and revenue directly from ledgers, the system eliminates manual calculations and reduces errors, saving time and increasing accuracy.
3. Granular Segment-Level Analysis
Not all parts of a business perform equally. Deskera ERP allows you to analyze margins at a more granular level—by product line, customer, region, or business unit. This visibility helps you identify high-margin offerings that deserve investment and low-margin ones that may need pricing or cost strategy adjustments. Segment-level insights lead to better, more targeted decisions.
4. Consistent Cost Classification
Margin analysis relies on consistently assigned cost categories. Deskera ERP enforces standardized accounting and cost classification practices across periods, reducing mistakes like misclassifying direct vs. indirect costs. This consistency ensures that your margin trends are valid and comparable over time.
5. Trend Tracking and Visual Dashboards
Understanding margin trends matters more than isolated snapshots. Deskera ERP provides interactive dashboards and trend charts that visualize margin performance across periods. You can quickly spot declines, seasonality effects, or improvements—and then investigate the underlying causes.
6. Integrated Operational and Financial Insights
Margins are influenced by operational factors like production efficiency and inventory costs. Because Deskera ERP integrates operations with financials, you can link margin results to operational performance indicators. For example, you can trace rising costs to specific bottlenecks or identify which operations are driving higher profitability.
7. Scenario Planning and What-If Analysis
Once you understand your current margins, the next step is to plan improvements. Deskera ERP supports scenario analysis by letting you model changes—like cost reduction options or price increases—and see their potential impact before implementation. This helps you make more confident, data-backed decisions.
8. Better Collaboration and Decision Support
Margin analysis often involves finance, sales, operations, and leadership working together. Deskera ERP’s shared platform ensures that everyone is working with the same data and insights, improving communication and alignment. Reports and dashboards can be shared across departments to support strategic planning and performance improvement.
By bringing financial and operational data together with automation, analytics, and visualization, Deskera ERP turns margin analysis into a powerful tool for business decision-making rather than a manual reporting exercise. It helps you not only calculate margins accurately but also understand the underlying story—and act on it.
Key Takeaways
- Margin analysis goes beyond revenue by revealing how much profit a business actually retains after costs, making it a more reliable measure of financial health than topline growth alone.
- Understanding margin analysis helps businesses connect revenue with costs, uncover inefficiencies, and compare profitability meaningfully across products, periods, and business sizes.
- Different types of margin analysis tell different stories—gross margin highlights production efficiency, operating margin reflects operational discipline, net margin shows overall financial health, and contribution and segment margins uncover profitability at a granular level.
- The objectives of margin analysis include controlling costs, optimizing pricing, improving performance measurement, allocating resources effectively, and supporting informed strategic planning.
- The margin analysis process works best when structured—starting with accurate data, calculating the right margins, tracking trends, analyzing segments, identifying drivers, testing scenarios, and acting on insights.
- Margin analysis delivers clear business benefits such as better pricing decisions, improved cost control, sharper strategic focus, stronger resource allocation, and enhanced long-term profitability.
- Common challenges in margin analysis—like incomplete cost allocation, overreacting to short-term changes, and relying too heavily on benchmarks—can distort insights if not addressed carefully.
- Avoiding margin analysis mistakes requires discipline, including consistent cost classification, trend-based analysis, proper treatment of indirect costs, and contextual interpretation of results.
- Technology plays a critical role in effective margin analysis, and tools like Deskera ERP simplify data consolidation, automate margin calculations, enable segment-level insights, and support real-time, data-driven decision-making.
- Ultimately, margin analysis shifts the focus from growth at any cost to profitable growth, helping businesses understand where value is created, where it is lost, and how to build sustainable financial performance.
Related Articles