![Complete Guide to Income Statements [+ examples and templates]](https://images.unsplash.com/photo-1553729459-efe14ef6055d?ixlib=rb-1.2.1&q=80&fm=jpg&crop=entropy&cs=tinysrgb&w=2000&fit=max&ixid=eyJhcHBfaWQiOjExNzczfQ)

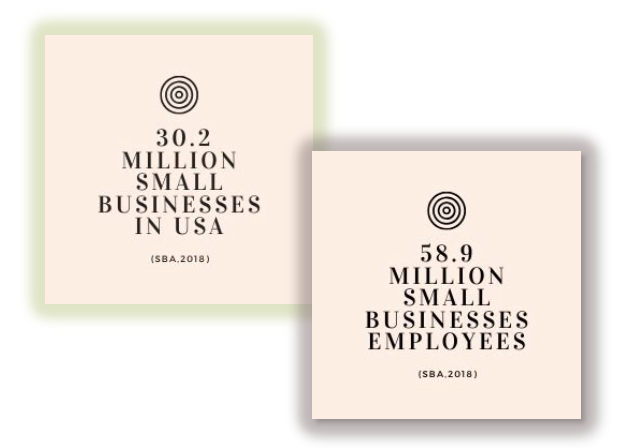
According to the statistics from the Small Business Administration, there are $30.2 million of small businesses across the United States of America, which accounts for 99.9% of all companies in the United States. And each one of them, including your business, need to prepare an income statement!
Why you should prepare an Income Statement
The income statement is a comprehensive breakdown of your company's operating and non-operating expenses and revenue. This financial statement tells you, in a glance:
a. where the business is earning money,
b. where the business is spending the money, and
c. if the business is running profitably
An income statement is what any potential investor will ask for as one of the first documents if they are serious about investing in your business. Any financial audit will require an income statement which will be studied and analyzed.
In addition to the above, a well prepared income statement speaks about the business and financial maturity of an organization. Which is why we will be going over income statements in great detail in rest of the article.
What we will cover
- Different Nomenclatures
- Types of income statement (Single and Multi Step)
- Multi-step income statements
- Understanding Chart of Accounts
- Examples from different industries
- Examples from the Big Four Tech Companies
- Where to study/source them from?
- Income Statement Excel Samples (Free Download)
Different Nomenclatures
The terms P&L statement, Profit and Loss Statement and Income Statement are used interchangeably. The income statement is sometimes also known as statement of revenue or earning statement.
Types of Income Statement
There are two primary methods followed to prepare income statements:
a. Single Step
b. Multi Step
A) Single Step Income Statement
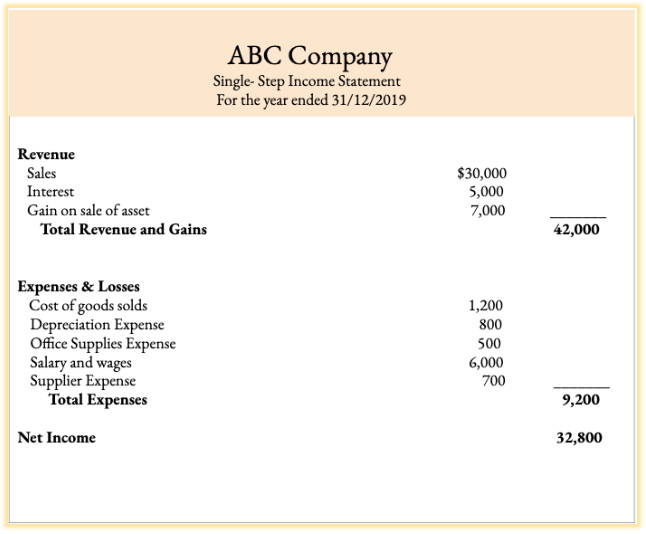
A single step statement lists every detail in a single column, and provides the summation of the rows. All the revenue is clubbed together, as are all the expenses. It does not delve into breakdown of operating costs or cost of goods sold or any sub categories.
The net income is calculated by subtracting the Total Expenses from Total Revenue. This is the only calculation used in a single step statement.
Net Income = Total Revenue - Total Expense
Although the single-step income statement is easier to prepare and understand, it does not provide comprehensive information of the company's gross profits or operations. Which is why, if a business plans to raise fund or apply for bank loans, then it must prepare a Multi Step Income Statement.
B) Multi-Step Income Statement
A multi step statement, as the name suggests, is broken down into various steps and provides a detailed overview of operating and non-operating revenue and expenses. It also shows the gross profit (or gross margin) as well as the net income.
The calculations involved in a typical multi step statement are as follows:
Gross Profit = Operating Revenue - Cost of Goods Sold
Operating Income = Gross Profit - Operating Expenses
Non Operating Income = Non Operating Revenue - Non Operating Expenses
Net Income Before Taxes = Operating Income + Non Operating Income
Net Income After Taxes = Net Income Before Taxes - Taxes
Some key points to note
Sales revenue is obtained from the selling activities of the company’s products, whereas the cost of goods sold is the expense incurred directly from producing the goods.
To compute the net sales, you will have to subtract the total revenue from any sales returns or sales allowances.
The gross profit gives you the idea of how much the sales covered the direct cost of producing the goods.
The derivation of operating income comes from the subtraction of the gross profit from the operating expenses. The operating costs are the cost to run the business.
Here are some of the examples of operating expenses:
A. Selling Expense
Marketing and Advertising
Any expense that relates to promoting, advertising, and campaigns held to raise awareness of the products or to sell the products.
Distribution Expense
The cost incurred to deliver the products from one place to another. It can be the freight cost incurred from sending the goods to the end consumers.
Sales Commission
The cost incurred for hiring salesperson to sell the products and paying additional fees to them once they reach their sales target.
B. Administrative Expense
Office rental
The expense related to renting office building to business operations.
Wages and Salaries
The cost incurred for hiring employees in the company to perform specific business tasks.
Office Supplies
Any expense related to office supplies such as providing stationery for every employee, papers, and ink for printing, to printer’s toner.
Depreciation of Office Equipment
The allocation of the cost of the office equipment such as desktops, printers, and other office equipment within its useful life.
Closer to the end of the income Statement, you should arrive at the company's net income. The net income is the sum of the operating income and non-operating income, after deducting interest expense and tax.
Non-operating income is the gain or loss from any sources not related to the core business activities. Here are some examples of non-operating income activities:
Gain or Loss from Investments
To compute the capital gain or loss, subtract the selling price of the investment products from the purchase price. Some of the investing activities performed by the company include investment in shares, property, index funds, or bonds.
Foreign Exchange Gain/Loss
The foreign currency gain and loss is the difference between converting the foreign currency to base currency, when the company sells goods and services in a foreign currency, by referring to the prevailing exchange rate.
Sales of Assets
Income generated from selling the company’s assets includes plant, property, trade names, leaseholds, or any inventory.
Of course, one might wonder where all these categories and sub categories are defined. This is what we will explore in the next section on Chart Of Accounts, where all these details are stored.
Charts of Accounts
In accounting, Chart of Accounts is a list of all the financial accounts used by the organization that comprises of reports used in both the general ledger and the Profit and Loss statements. All the categories and sub categories one sees in an income statement are from the chart of accounts.
The Chart of Accounts usually consists of the 5 different types of accounts - Assets, Liabilities, Revenue, Expenses, and Equity. It's then broken down into more categories and sub-categories.
Not every company shares the same Charts of Accounts, and it can vary depending on the nature of your business.
Typically, businesses assign a specific code to each of the accounts to identify the records conveniently. The account's code could be in numerical, alphabetical or alphanumerical format based on the organization's preferences.
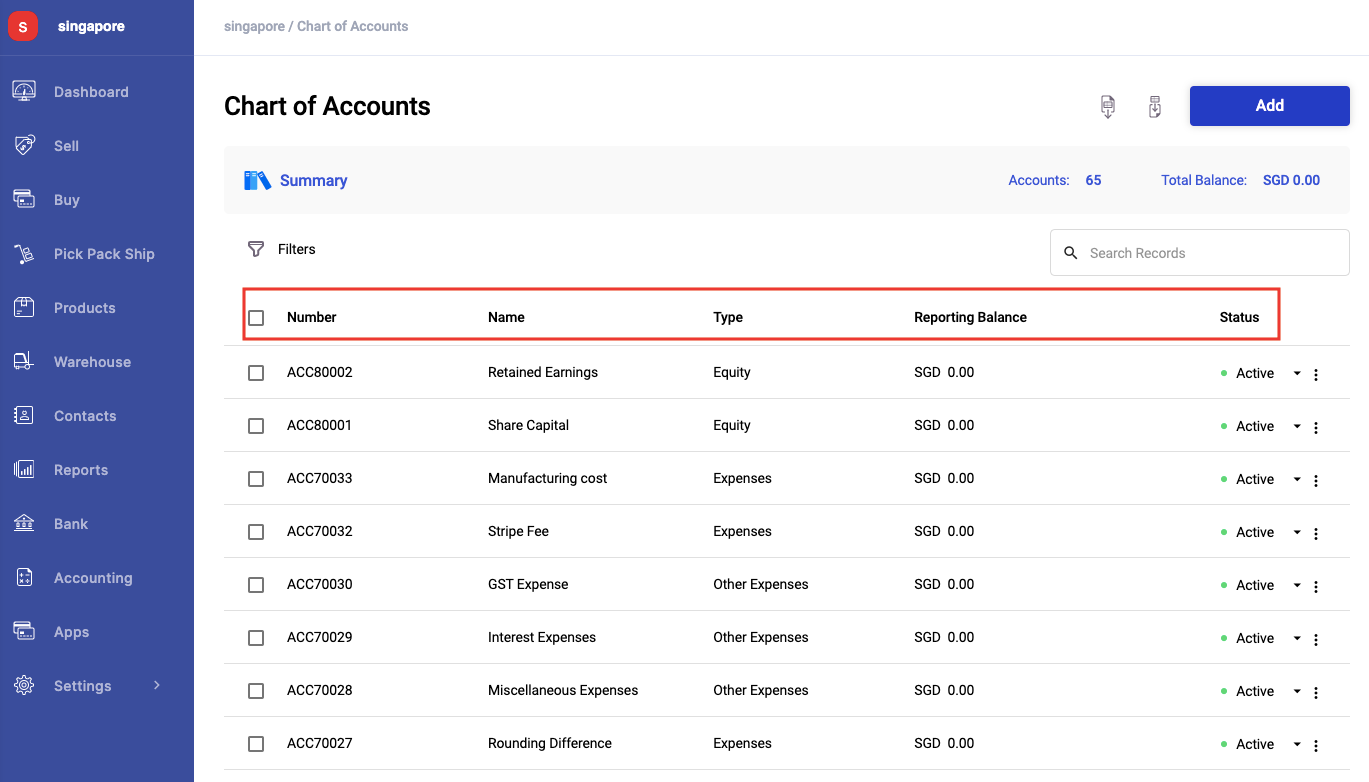
The image shown above is Deskera Books' Chart of Accounts by default. Small businesses can create the account code and tag each of the account to the respective category.
Income Statement Examples from Different Industries
As we have already walk through the types of income statement earlier, let us now view and analyze the multi-step statements generated by a few public listed companies from different industries.
The industries that we will cover below are:
1. Merchandising industry
2. Manufacturing industry
3. Services industry
4. E-commerce industry
Merchandising Industry
Merchandising industry are the companies that sell final products to the end consumers. Based on the study done by Statista, the top merchandise products in the U.S are the home and school office supplies, which amounted to 4.21 billion U.S dollars.
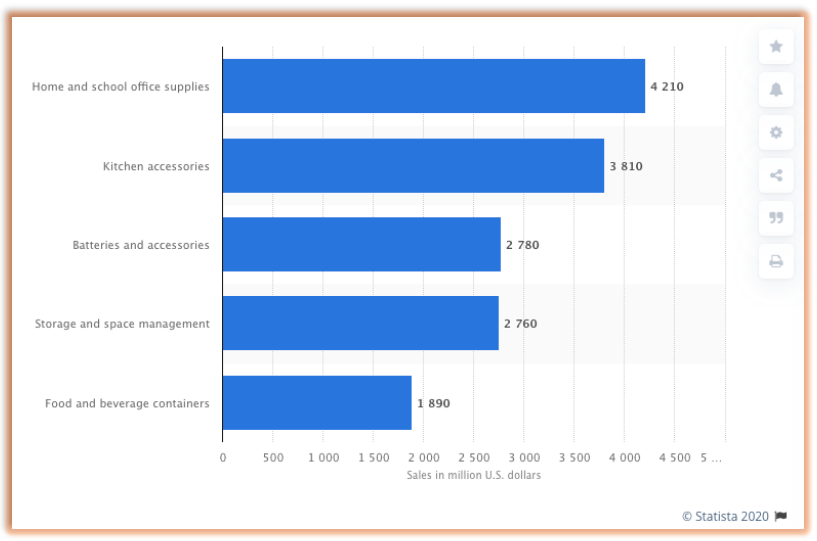
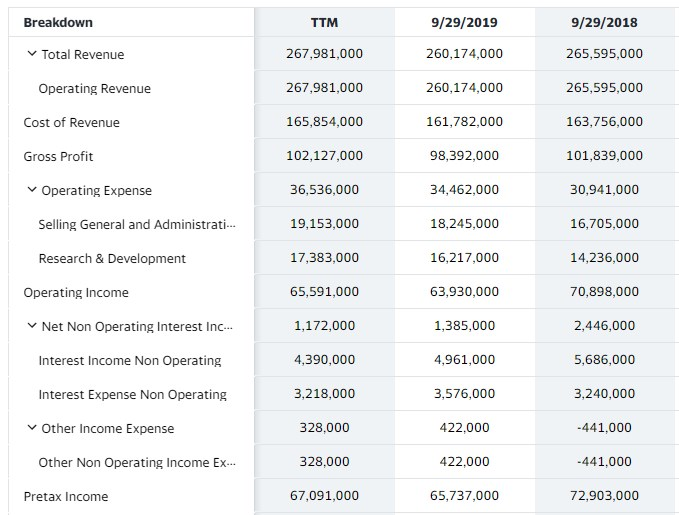
Let's check out the the income statement from 3M corporation, one of the most popular home and school supplies' companies in the world.
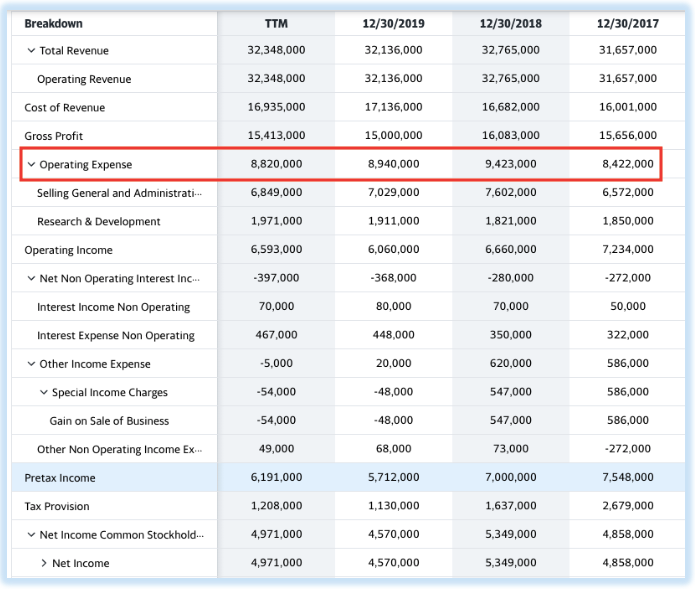
Based on 3M's income statement, you can view the breakdown of the operating expense and operating income into different sub-categories. For instance, the operating expense incurred by 3M Corporation includes selling, general and administrative expense and Research and Development Expense.
The selling, general, and administrative expense is the most prevalent type of expense incurred by all businesses. On top of that, 3M companies also invest their funds in the Research and Development field. They have thousands of researchers scientists and researchers from all over the world to carry out their R&D activities.
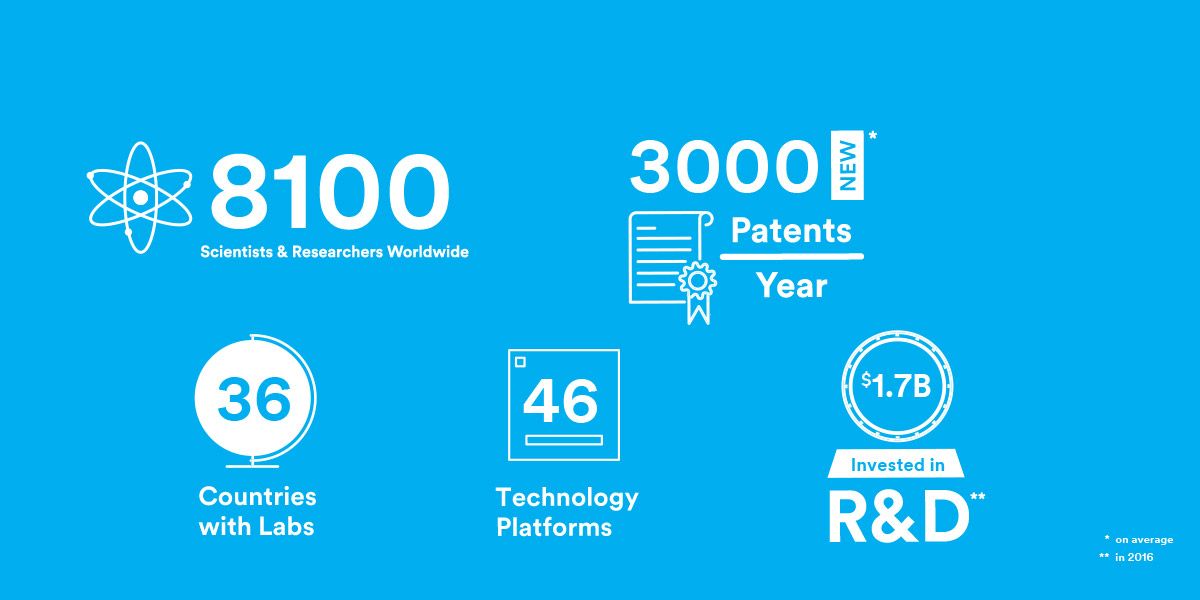
Due to extensive research, the company produces more than 3,000 patents each year. Aside from that, they have various patents to industries, such as the healthcare, automotive, technology, and the electronics industry. And we can determine this by one look at the income statement!
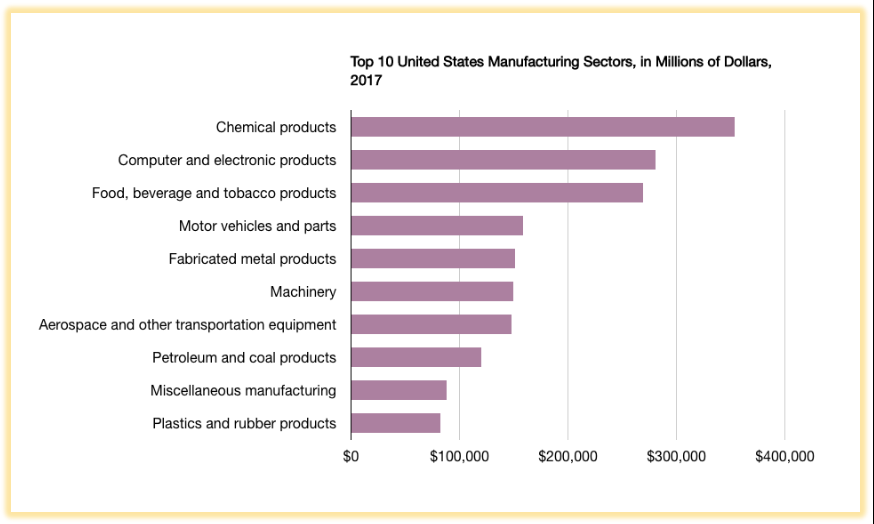
Manufacturing Industry
The manufacturing industry involves processing raw materials using colossal machine, tools, chemicals, or formulation to produce the finished product. According to the study done by the Bureau of Economic Analysis, manufacturing is part of the component of gross domestic product, which was worth $2.33 trillion back in 2018.
Intel is the biggest semiconductor chip manufacturer in the world. Intel manufactures network interface controllers, processors, and other computing devices that are in high demand. It also supplies microprocessors to other big companies such as Apple, Dell, and Lenovo.
So, let’s have a look at the income statement prepared by Intel Corporation.
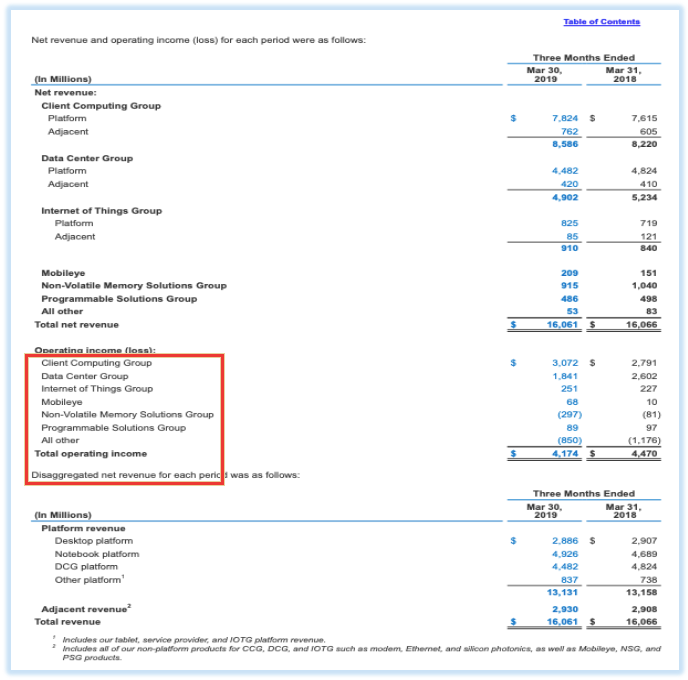
Intel’s income statement shows the breakdown of its operating income into a few groups. As the company is enormous, Intel manages its business by segmenting the processes into different groups.
You can also note that Intel has a various stream of operating income from a few different groups as shown above such as;
• Client Computing Group
• Data Center Group
• Internet of Things Group
• Mobileye
• Non-volatile Memory Solutions Group
• Programmable Solutions Group
• All other
These are the various business units that contribute to Intel’s total operating income as a whole.
The accounts used in the preparation of the income statement are different for different companies. Some of the companies do not have a variety of business units. Therefore, they derive their operating income only from one business unit.
Service Industry
Also known as the tertiary sector, the service sector comprises education, healthcare, social worker, computer services, communications, banks, and the hotel industry. As the name suggests, the services industry does not provide any tangible products to the final consumers as they only offer services as the final goods.
Today, we will look at Wyndham Hotels, and Resorts's income statement in the United States.
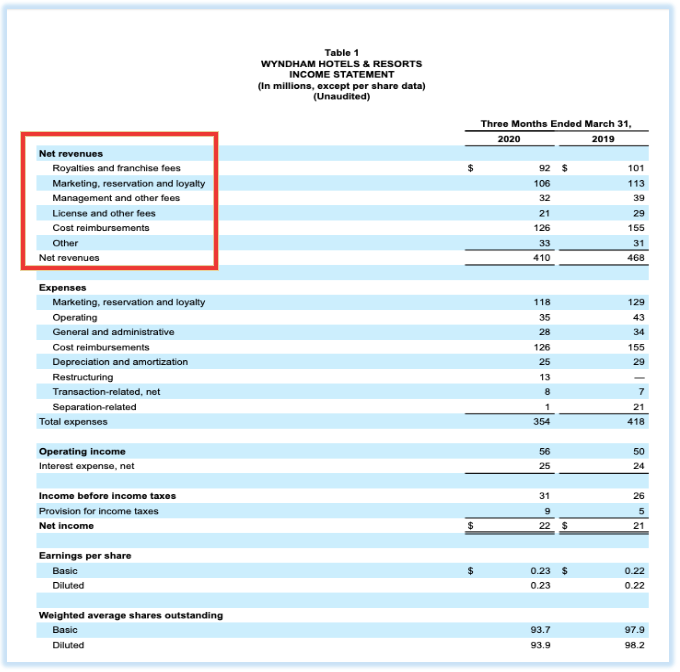
The income statement shown above is the Wyndham Hotels and Resorts’ income statement for the first quarter, 31st March 2020 and 2019 (unaudited).
Based on the analysis of this income statement, you can see that there is no cost of goods sold involved to compute the net revenue.
The reason there is no cost of goods sold account involved is that the service industry does not produce any end products. The primary source of revenue is from the service they provide to the end customers.
The net revenues for Wyndham Hotels and Resorts derive from royalties and franchise fees, marketing reservation and loyalty fees, management, and other fees, license and additional fees, cost reimbursement, and others.
E-Commerce Industry
The e-commerce industry is a multi-billion dollar worth and one of the fastest growing sectors in the world. As we progress towards digitization, more businesses are starting to sell their products and services online.
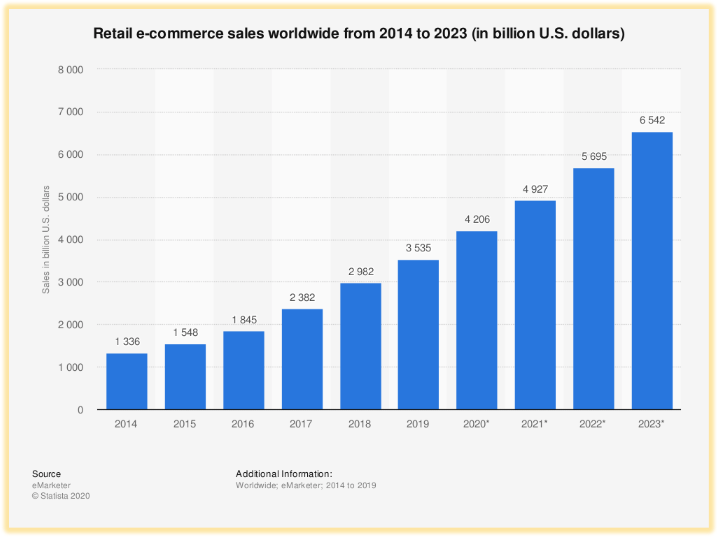
E-commerce sales reached $3.5 trillion in 2019, and pre-Covid-19 predictions show that the number will grow to $6.54 trillion in 2023.
Let us have a look how the biggest eCommerce player in the world, Amazon, prepares its income statement.
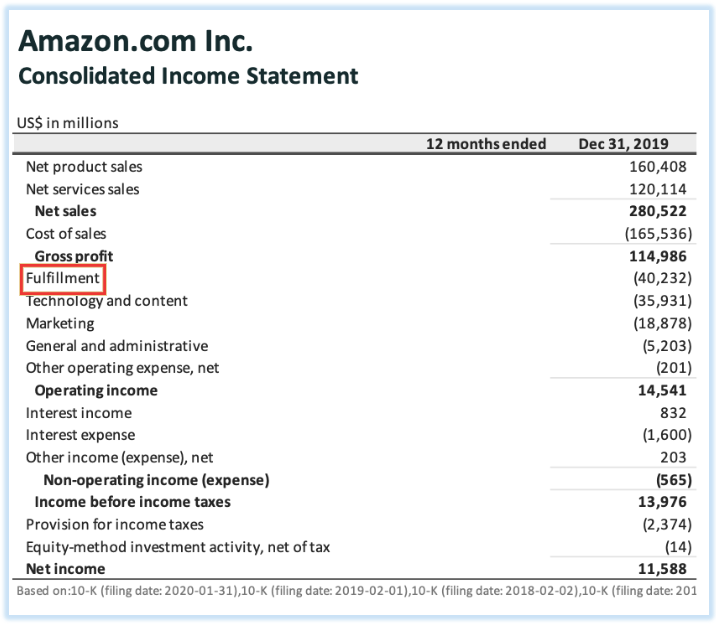
The net sales of Amazon, the largest e-commerce company, derives mainly from its online store.
Apart from online stores, Amazon also generated revenue from its physical stores as they used to have brick and mortar stores before transforming into the e-commerce business. The company's revenue also comes from other sources, such as third-party seller services, subscription services, AWS, and others.
One of the operating expenses of Amazon is the fulfillment expense. A smaller e-Commerce company can avoid high fulfillment costs if they use dropshipping. You can find out how Deskera Books could help with your business with inbuilt support for dropshipping.
Examples of income statement from the Big Four Tech Company
Any discussion on financial statements would be incomplete without taking a look at the financial statements from the big tech companies. We already looked at Amazon in the section above, and here are the others.
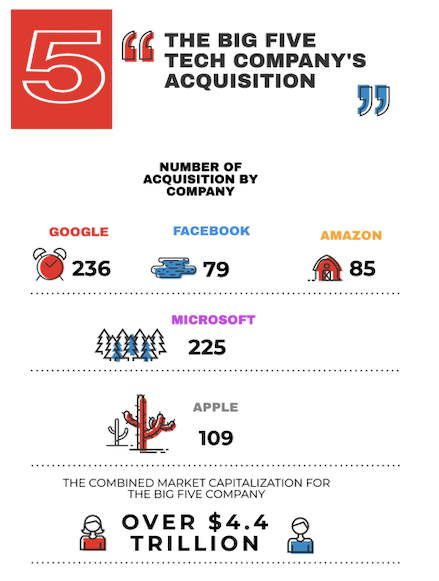
The most popular Big Five tech companies are Apple, Google (Alphabet), Facebook, Amazon, and Microsoft. These giant companies are also known as "FAAMG." Based on the source from Visual Capitalist, the combined market capitalization for the Big Five giant tech company are worth more than $4.4 trillion!
Apple Inc.
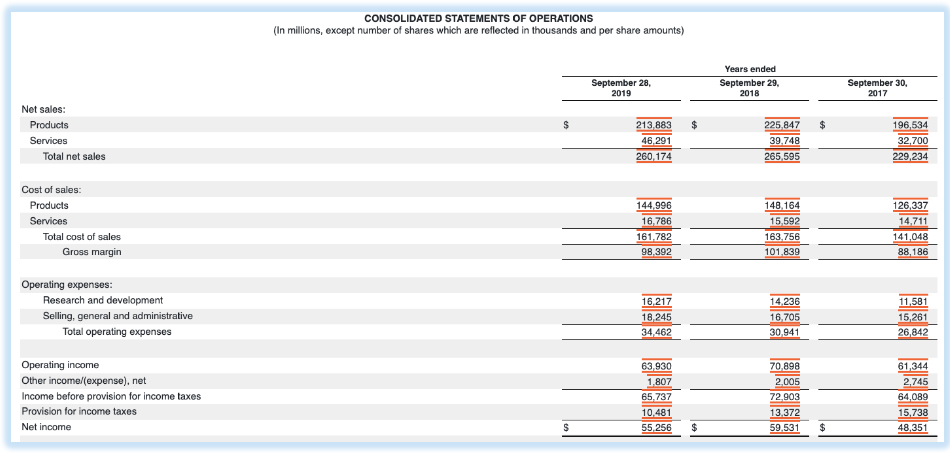
The income statement shown above is the financial report prepared by Apple Inc.
Based on the report, the company's net sales are the summation of the sales from the products and services they provide to their customers. The gross margin can be computed by subtracting the total cost of sales from the total net sales.
The operating expenses incurred are similar to other companies such as Apple allocated expenses to selling, general and administrative tasks and also Research and Development.
The net income of Apple Inc for the month year ended September 28, 2019 is a total of $55,256 millions!
Facebook is one of the popular social media platforms for social networking and also advertising. Founded by Mark Zuckerberg in early 2004, Facebook has about 2.6 billion users worldwide today.
Let us take a look at Facebook's income statement.
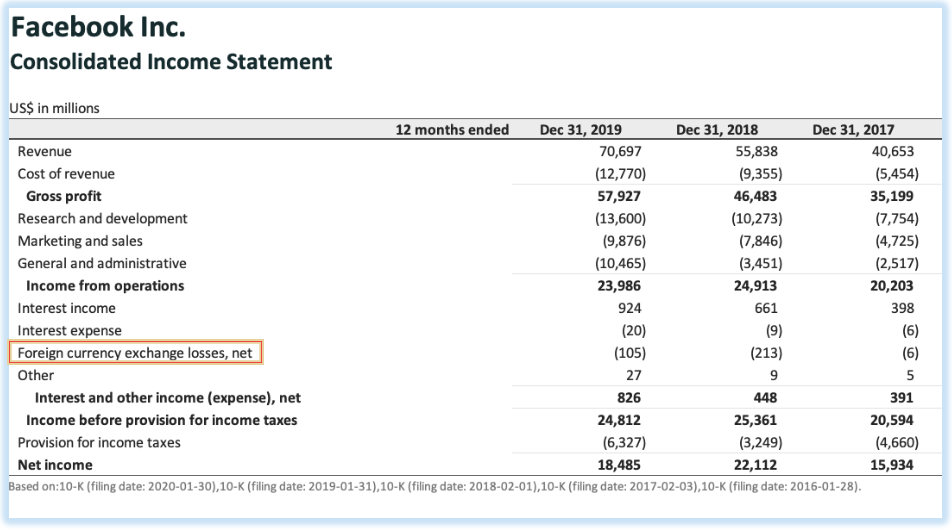
Facebook's operating expense includes Research and Development, Marketing and Sales, and General and Administrative tasks.
Facebook's exposure to foreign currency risk is due to the fluctuations in their net income from the transaction gain and losses related to certain current assets and current liabilities, denominated in other currencies.
The foreign currency losses in the year 2017 is US$6 million, US$213 million in the year 2018, and US$105 million in 2019, as shown based on the income statement report.
As per the report, the net income for Facebook decreased from US$ 22,112 million in 2018 to US$18,485 million for the year 2019.
Microsoft
Microsoft is one of the Big Five Tech Company that needs no introduction. Microsoft is also known worldwide for its consumer electronics such as computers, laptops, computer software, and other related services.
Let's take a look at Microsoft's income statement.
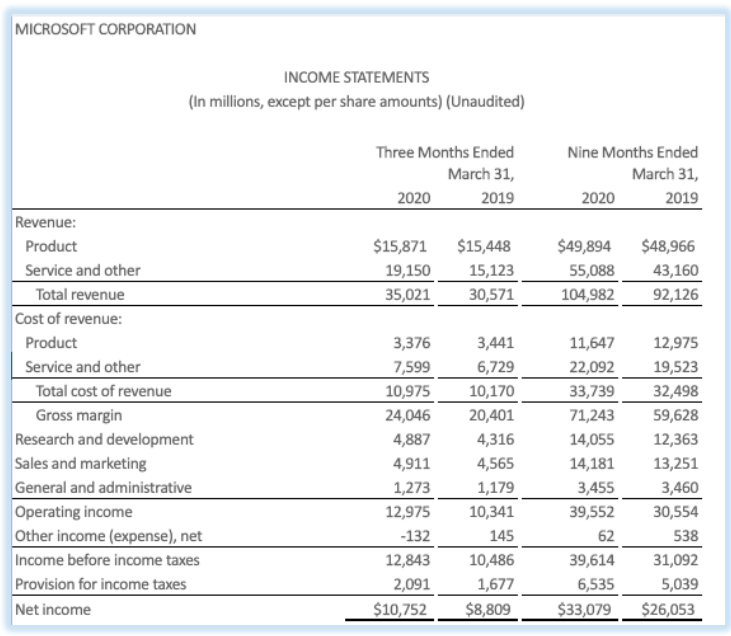
Microsoft derives its revenue from both the sales of products and services. By deducting the cost of revenue for products, services, and others, the gross margin for three months ended March 31, 2020, is a total of $24,046 million.
The operating expenses involve three accounts, including Research and Development, Sales and Marketing, and General and Administrative.
Microsoft Corporation pays a total of $2,091 million in income taxes for the three months ended, March 31, 2020. After subtracting the income tax, the net income stands at $10,752 million.
The parent company of Google is Alphabet Inc. Alphabet Inc is a multinational technology company that provides internet-related services and products. Some of the products and services from Alphabet Inc include the search engine, online advertising technologies, hardware, and cloud computing software.
Let us dive deeper into the income statement prepared by Alphabet Inc.
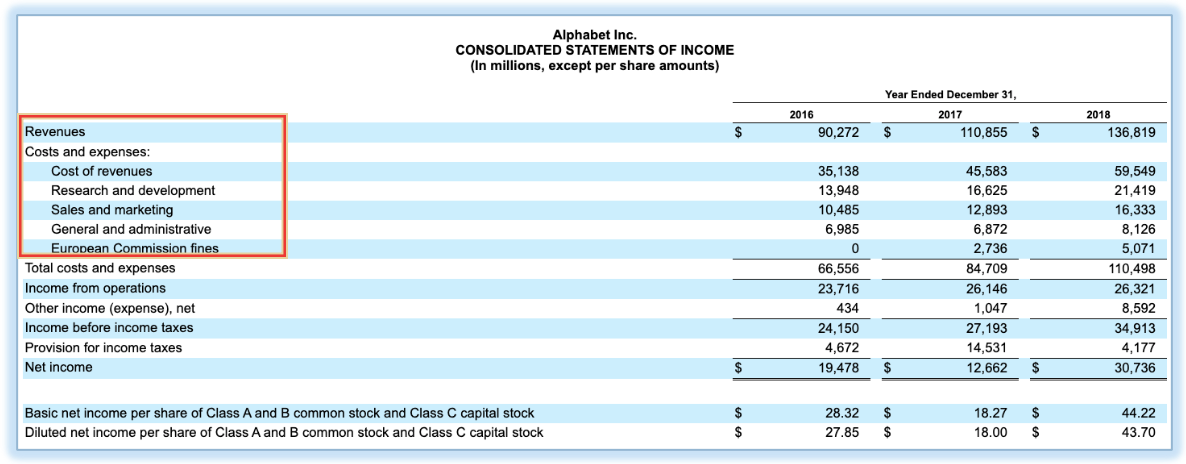
Based on the consolidated income statement from Alphabet Inc, you notice that the costs of revenue and operating expenses are combined without breaking down into two separate accounts. For the previous company mentioned above, most of the companies separate the cost of goods sold account from the operating expense account instead of lumping them together.
The company then fetched its income from operations by deducting the revenue from the total costs and expenses. They did not highlight the gross margin figure and dive straight to the income from the operations account.
An unusual account/heading that shows up here is the European Commission Fines.
According to the European Commission, the EC has fined Google for breaching the European anti-trust rules. The infringement is due to the restrictive clauses in their contracts with third-party websites that prevent competitors from placing search advertisements on these websites. Therefore, Alphabet Inc has to pay the fines imposed on them.
How to See Income Statements Online
If you are keen to study the income statement of public listed companies, then this section is for you.
Yahoo Finance
Yahoo Finance is a popular tool that most University students used to extract financial data from the public listed company for their research.
First of all, go to the Yahoo website.
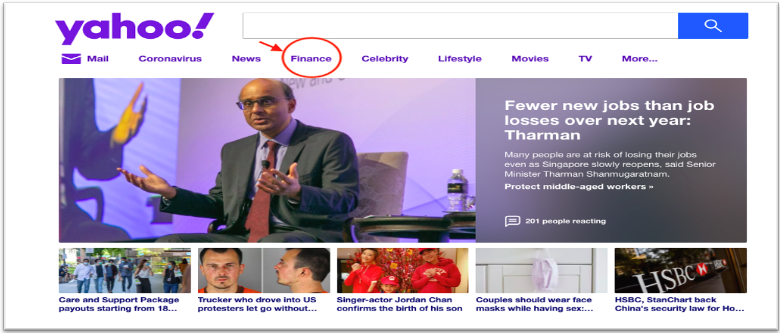
Once you have landed on Yahoo website, you can hover your mouse towards the Finance section and click on it.

You can use the search bar to find the financial reporting for all the public listed companies in the world.
For instance, if you search Go in the search bar, there will be a list companies close the company's name "Go" appear in the drop-down selection. Choose the relevant company that you are looking for.
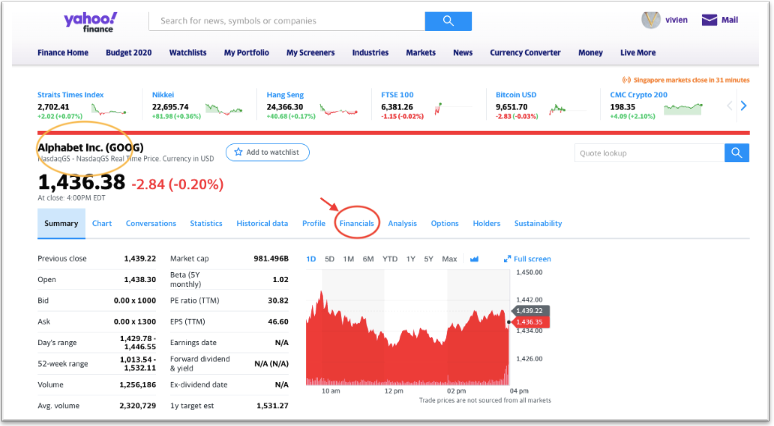
Once you have selected the right company, the company name will appear at the top right of the page. For instance, you can view the company's name Alphabet Inc. (GOOG) based on the image above, to confirm it's the right company. Click on the Financials section.
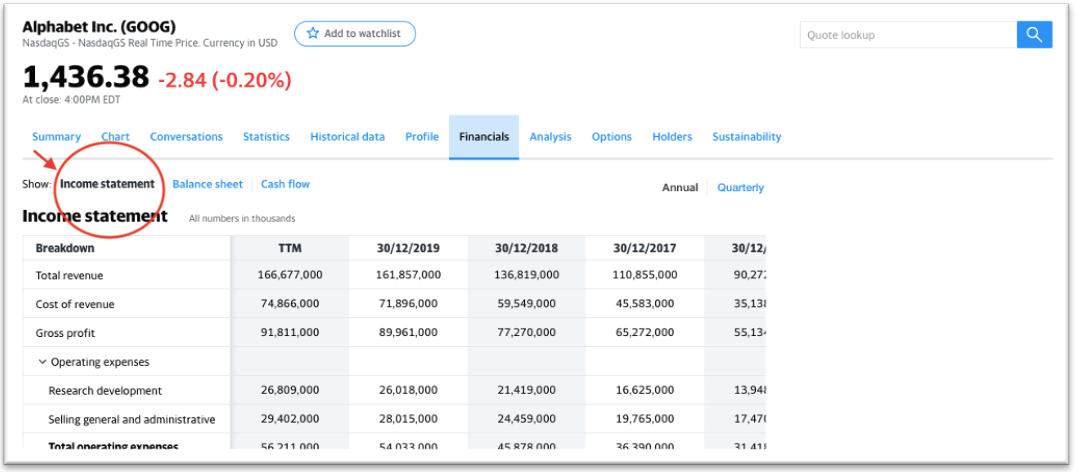
In this page, small business should be able to view the company’s financial reporting, such as the income statement, balance sheet, and also cash flow statement for few years. Switch to Quarterly report, if you wish to view the quarterly report instead.
EDGAR
Besides Yahoo Finance, you can also utilize the EDGAR website to download the public listed companies in the United States.
EDGAR is the short form of Electronic Data Gathering, Analysis, and Retrieval. It is created by the Securities and Exchange Commission in America to increase the efficiency and accessibility of corporate filing. All the publicly traded companies in America are required to file their reports compliant with SEC.
To use this, first of all, go to the EDGAR website.
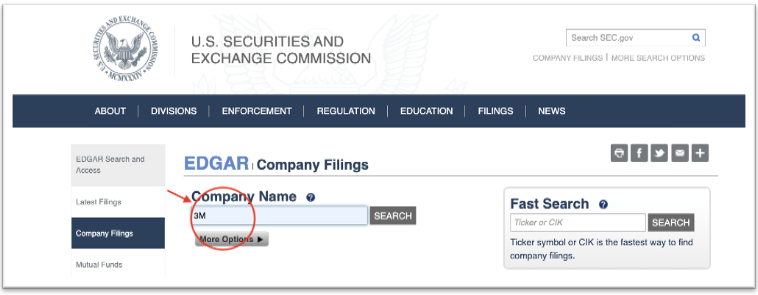
Make sure that you’re on the company's filing page. Next, enter the company name you are looking for and click on the Search button.
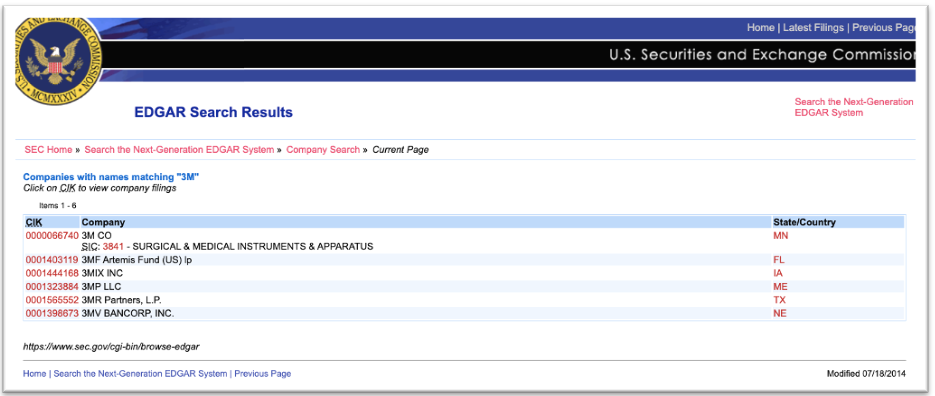
A list of the company's names will appear. Click on the numbering link on the first column of the company's financial data that you wish to view. Next, you should be able to see all the types of filing done by the company.
You can search for the company's annual report using the filter selection, as shown above.
Enter the filing types in the search box. If you wish to view the annual report, enter 10-Q and 10-K for quarterly and yearly annual report. Click on the Documents button under the Format column.
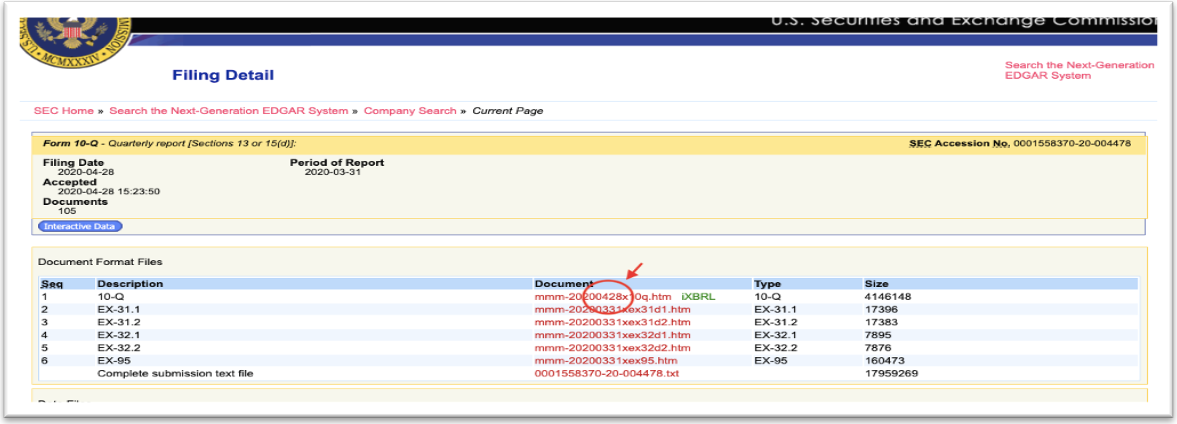
Lastly, to view the company annual report, click on the numbering link under the Document column.
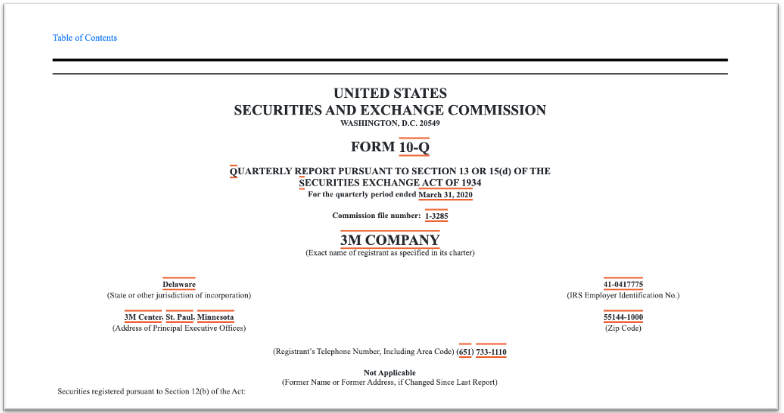
Lastly, you should be able to view the company's annual report for the year you have indicated. In this report, you should have comprehensive details of the company's performance.
Also, you can view the company's consolidated income statement, balance sheet, and statement of cash flow in this annual report.
Free Income Statement Template Download
Most people have a hard time preparing and generating financial statements from scratch. Which is why we have prepared some easy to use excel templates for you to download and use.
In the long run though, it is advisable to move away from excel and use an online accounting software to auto generate your income statement. Deskera Books can do this easily for you. You just have to record your transactions and a multi-step income statement is generated for you by the system.