
Ever wondered which are the basic financial statements your business might use? There are three important financial statements, namely the balance sheet, the income statement, and the cash flow statement.

Check out our comprehensive guide on financial statements calculations with examples if you're new to financial reporting. Following are the topics covered:
- Understanding Financial statements
- Financial Calculations and Ratios
- Limitations of Financial Statements
- Benefits of Financial Statements
- Key takeaways
Understanding Financial statements
Financial statements are documents that describe a company's operations and financial performance. Government organizations, accounting companies, etc. frequently audit financial statements to guarantee accuracy and for tax, financing, or investing purposes.
The process of examining information from a company's financial papers and statements is described by the financial statement analysis definition. Each of them refers to various financial factors while providing information about the company. While some statements concentrate on assets and liabilities, others concentrate on the company's revenue and outgoing costs.
- Ratios including liquidity ratios, profitability ratios, leverage ratios, debt ratios, turnover ratios, and solvency ratios can also be used in financial research.
- Financial information is used by investors and financial analysts to assess a company's performance and forecast where the stock price will go in the future.
- The annual report, which includes the company's financial statements, is one of the most significant sources of trustworthy and audited financial information.
Investors, market analysts, and creditors assess a company's financial status and profits potential using its financial statements. The balance sheet, income statement, and statement of cash flows are the three main financial statement reports.
Balance Sheet
A balance sheet gives specific details about the assets, liabilities, and shareholders' equity of a company.
A list of the components of a balance sheet is shown below.
Assets
Assets are valuable possessions that a business holds. This often means that they can be employed by the business to create goods or render services that can be sold, or they can be sold themselves.
Physical assets include things like buildings, vehicles, machinery, and stock. It also includes assets like patents and trademarks that are immovable yet nevertheless exist and have value. Cash is also a form of asset. Investments a corporation makes are also.
- Accounts receivables are the sums due to the company by its clients for the sale of its goods and services.
- Cash and cash equivalents are liquid assets, which may include Treasury bills and certificates of deposit.
- Inventory
Liabilities
A company's liabilities are the sums of money it owes to other parties. This might refer to a variety of debts, such as loans taken out by a firm to launch a new product, building rent, payments made to suppliers for supplies, employee salary, costs associated with environmental cleaning, and taxes owed to the government. Providing future customers with goods or services is another example of a liability.
Shareholders' Equity
Equity held by shareholders is also referred to as capital or net value. It is the amount that would remain after a business sold all of its assets and settled all of its debts. The shareholders, or business owners, are the rightful owners of this surplus cash.
- A company's entire assets less its total liabilities equals its shareholders' equity. Shareholders' equity, also called stockholders' equity, is the sum of money that would be given back to shareholders if all the company's assets were sold and all of its debts were settled.
- The portion of net earnings that was not distributed to shareholders as dividends is known as retained earnings and is included in shareholders' equity.
What a balance sheet reveals is summarized by the formula below:
An organization's assets must "balance" (equal) the total of its obligations and shareholders' equity.
Income Statements
An income statement is a document that details the amount of revenue a company brought in during a particular time frame (usually for a year or some portion of a year). The costs and expenses incurred in generating that money are also displayed on an income statement. The company's net profits or losses are typically displayed in the statement's literal "bottom line." This reveals how much money the business made or lost within the time frame.
Earnings per share, or "EPS," is also disclosed in income statements. You can use this method to determine how much money shareholders would get if the business opted to distribute all of the period's net earnings.
Almost rare do businesses share all of their profits. Typically, they put them back into the company.
Cash Flow Statements
The inflows and outflows of cash at a corporation are shown in cash flow statements. This is crucial because a business needs to have sufficient cash on hand to cover its costs and buy assets. A cash flow statement can show whether a company created cash flow as opposed to an income statement, which can show whether a company made a profit.
Investors may learn how a firm operates, where its funding comes from, and how it spends money thanks to the CFS. The CFS offers information about a company's financial stability as well. A cash flow statement cannot be calculated using a specific formula. Instead, it has three sections that detail the cash flow for the many purposes that a business uses its funds. The following is a list of the three CFS components.
Operating Activities
The cash flow from net income or losses of a corporation is examined in the first section of a cash flow statement. The majority of businesses use this area of the cash flow statement to compare the net income (as reported on the income statement) to the real cash it received or spent on its business operations. Any adjustments to cash, accounts receivable, depreciation, inventory, and accounts payable are included in cash from operations.
Wages, tax payments on income, interest payments, rent payments, and cash earnings from the sale of goods or services are also included in this list of transactions.
Financing Activities
Funds used for financing comprises payments made to shareholders as well as cash obtained from banks or investors. Loans, dividend payments, stock repurchases, equity issuances, debt repayments, and loans are all examples of financing activities. In three key company activities, the cash flow statement reconciles the balance sheet and the income statement.
Investing Activities
Any sources and uses of money from a corporation's investments into the long-term success of the company are considered investing activities. This group includes any payments connected to a merger or acquisition as well as the acquisition or sale of an asset, loans given to or received from suppliers, and customer loans.
Additionally, this part includes purchases of permanent assets like property, plant, and equipment (PPE). In other words, changes to investments, equipment, or assets are related to cash from investments.
Financial Calculations and Ratios
Financial ratios show how well your company is doing financially in many areas, such as its ability to pay off debt or its level of profit.
By entering your financial data into formulas, you can utilize these ratios. Depending on whose financial statement you're examining, you can utilize a variety of formulas, or different ratios.
Einstein-level calculations may be used by financial counselors, investment gurus, CPAs, and writers of company annual reports to assist their customers in making financial decisions. But in this article, we'll focus on the most basic, crucial ratios that business owners use to assess the financial accounts of their organizations and make day-to-day operational decisions.
1. Liquidity ratios
The ability of a company to quickly convert its assets into cash is indicated by the usage of liquidity ratios. These ratios demonstrate a company's ability to cover its costs. The current ratio, cash coverage ratio, quick ratio, and liquidity index are all examples of liquidity ratios.
One popular ratio for assessing liquidity is the current ratio. The company consults the balance sheet's current assets and current liabilities to ascertain this. Divide the quantity of current assets by the quantity of current liabilities to obtain the current ratio:
Example
If a company has $800,000 in current assets and $500,000 in current liabilities, the current ratio would then equal:
Solution
Current Ratio = $800,000 / $500,000
=1.6
It demonstrates the company's ability to cover its costs and settle its short-term debts.
Meaning a ratio of 1.6:1 (assets: liabilities).
If your current ratio is less than 1:1, you're in trouble since you don't have enough current assets on hand to pay off your short-term debts. Your current ratio shouldn't fall far below 2:1. The better able you are to cover liabilities, the greater your ratio.
2. Debt-to-equity ratio
A company's total debt is compared to its owners' equity using the debt-to-equity ratio. A company's balance sheet will contain both of these figures. Divide a company's total liabilities by its shareholder equity to determine its debt-to-equity ratio
If a corporation has a debt-to-equity ratio of 2:1, it means that for every $1 invested in the company by shareholders, there are $2 in debt. In other words, the company is borrowing money at a rate that is twice as fast as the rate at which its owners are investing in it.
Example
At the end of 2020, ABC Ltd. had total liabilities of $14.2 billion and total shareholder equity of $9.65 billion.
The D/E ratio will be calculated as follows: D/E ratio= $14.2 billion / $9.65 billion.
D/E Ratio is therefore 1.47.
The larger leverage ratio of ABC initially seems to signal a higher danger. Further research would be required because this might be too generic at this point to be useful.
3. Operating margin
Comparing an organization's operational income to net revenues is called operating margin. The income statement of a corporation will include both of these figures. You divide a company's operational income (before interest and tax charges) by net revenues to determine operating margin, or
The most common way to express operating margin is as a percentage. It displays the percentage of profit made for every dollar of sales.
Example
Let's say that the XYZ Company recorded $110 million in net sales revenue on its 2020 annual income statement. Operating income for the year was $40 million, with total COGS and operating costs of $70 million. The operating margin for it is 40% ($40 million/$100 million multiplied by 100).
4. Inventory turnover ratio
The average inventory balance for the time period is compared to a company's cost of sales on its income statement. Examine the inventory figures presented on the balance sheet to determine the average inventory balance for the time period. Divide the difference between the balances shown for the report's period and the most recent comparable period by two. (Keep in mind that balance sheets represent moments in time.
As a result, the ending balance of the current period's inventory is equal to the balance at the beginning of the previous period's inventory.)
You divide a company's cost of sales, which appears on the income statement just below net revenues, by the average inventory for the time period to determine the inventory turnover ratio.
A company's inventory was turned over twice during the reporting period if its inventory turnover ratio was 2 to 1.
Example
The average inventory value of a company was $100,000 last year, while its COGS was $300,000. As a result, the inventory turnover ratio will be
Inventory Turnover Ratio =$300,000/$100,000
Business’s inventory turnover ratio would be 3.
5. Working capital
Working capital is the money that would remain after a business used its current assets to pay its current obligations, or debts that are due within a year of the balance sheet date.
Example
Let's say that EXC Limited has $15,000 in current assets and $15,000 in current liabilities. Next, figure out the company's WC.
Solution:
Given that the company's current liabilities exceed its current assets, the NWC would be (-$5,00,000). Due to the company's negative working capital, EXC Limited is experiencing a liquidity crisis, which will ultimately impede business operations.
As far as the Credit Rating Agencies are concerned, such a high negative WC is a bad omen, prompting them to reduce the rating by one notch if the situation does not improve.
6. P/E ratio
A company's common stock price and earnings per share are compared using the P/E ratio. You divide a company's stock price by its earnings per share to determine its P/E ratio, or
Example
The P/E ratio of a corporation is 10 to 1 if its stock is trading at $30 per share and it earns $3 per share. The stock of the corporation is trading at 10 times earnings.
7. Current liability coverage ratio
The current liability coverage ratio reveals your current cash flow vs. the amount of debt you have coming due in the near future, usually within a year.
You must determine your current average obligation in order to utilize this formula. Calculating an average takes it into consideration so you can get an approximate number. Your current liability can fluctuate month to month as you pay down the principle on a debt.
To do this, sum up all of your current liabilities at the start and end of an accounting period, divide the total by 2, and you will have your current liabilities.
Here’s the formula for calculating your current average liability ratio:
Example
Let's assume that at the start of March and the end of March, a company's balance sheet showed total current liabilities of $900 and $800, respectively. And they made $100 from their working activity.
Hence current average liability= (900 + 800) / 2 = 850
So, their current average liability is $950.
Here’s calculating your current average liability ratio:
For the company, that would look like this:
Current Average Liability Ratio = 100 / 850 = 0.12, or 12%
A current liability coverage ratio of less than 1:1 indicates that the company's cash flow is insufficient to satisfy its immediate liabilities. In this instance, there is space for improvement for the company.
Limitations of Financial Statements
Financial statements have limitations even if they offer a plethora of information about a company. Due to the statements' ambiguity, investors frequently come to quite diverse conclusions about a company's financial success.
For instance, some investors could prefer to see their money put in long-term assets, while other investors might favor stock repurchases. For one investor, a company's level of debt may be acceptable, while for another, it might raise concerns.
It's crucial to compare financial statements from different time periods to look for trends and to assess how the company's performance compares to that of its competitors in the same sector.
Benefits of Financial Statements
- Financial statements demonstrate a company's operations. It gives information about a company's assets, liabilities, operating expenses, cash flow management effectiveness, and how much and how a company earns revenue. A company's management style is entirely revealed through its financial accounts.
- Tracking the development and performance of the company and assessing its financial health are the fundamental goals of financial analysis. The value of the company can also be ascertained or measured with the aid of financial analysis. Financial statement analysis has numerous advantages for businesses.
- Due to the knowledge that investors and lenders gain from financial statement analysis, businesses can expand or grow. A company may be successful in attracting investors to help it expand if it can demonstrate its financial soundness to potential investors.
- The company can similarly demonstrate to lenders that it is deserving of and eligible for capital financing. Analysis of financial statements is helpful for adhering to rules and good corporate governance.
Main Items Shown in Financial Statements
Revenues, costs of goods sold, taxes, cash, marketable securities, inventory, short-term debt, long-term debt, accounts receivable, accounts payable, and cash flows from investing, operating, and financing activities are the most typical line items in a financial statement. The line items in a financial statement will vary depending on the corporation.
How can Deskera Help You?
Deskera Books can help you automate and mitigate your business risks. Creating invoices becomes easier with Deskera, which automates a lot of other procedures, reducing your team's administrative workload.
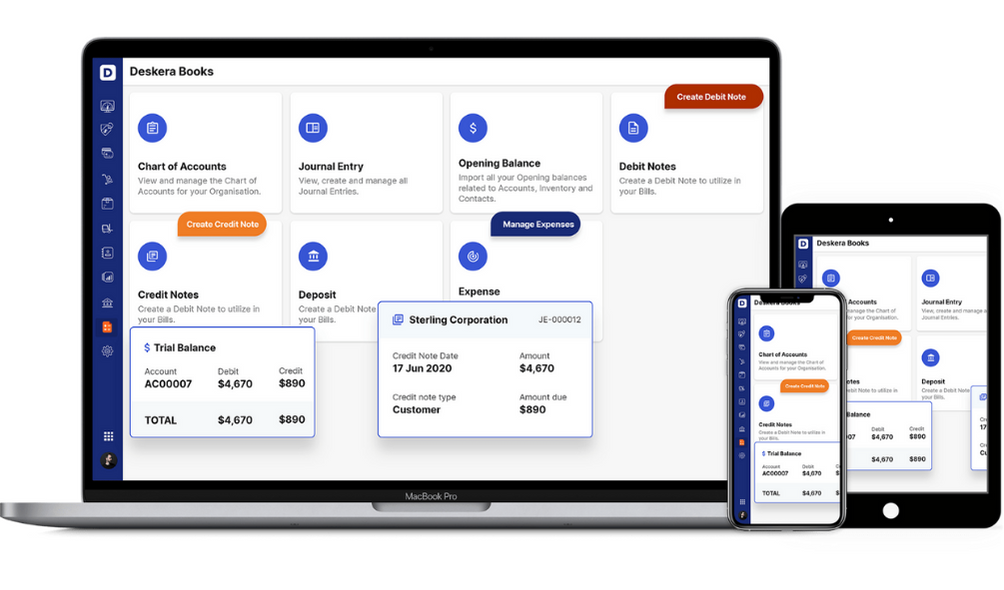
Sign up now to avail more advantages from Deskera.
Key takeaways
- The balance sheet, the income statement, and the cash flow statement are the three most crucial financial statements. Together, these three statements display a company's assets, liabilities, revenues, expenses, and cash flows from financing, investing, and operating operations.
- Financial statements are documents that describe a company's operations and financial performance.
- An income statement is a document that details the amount of revenue a company brought in during a particular time frame (usually for a year or some portion of a year). The costs and expenses incurred in generating that money are also displayed on an income statement. Typically, the statement's literal "bottom line" displays the company's net profits or losses.
- The balance sheet, cash flow statement, and income statement are the three primary financial statements that are used in the financial analysis process. It entails reading over these records and examining the facts or information that has been recorded. These statements each provide various types of financial insight.
Related articles