
Be it a retail business, wholesale, or any business that deals with inventory or stock or goods, inventory control or inventory management are crucial practices that help drive the profit of a company. Inventory is basically articles that are held for resale, for use in manufacturing of a product or for consumption in carrying on business activity.
A recent study suggests that companies can reap a 25% increase in productivity, a 20% gain in space usage, and a 30% improvement in stock usage, with the right inventory control method. Inventory management and inventory control's goal is to increase profits and performance of the entire supply chain and order fulfillment process. They can do this by articulately forecasting demand, reducing inventory carrying cost, managing quality, and increasing the value of the inventory.
One such inventory control method in inventory management is the FSN analysis, where FSN stands for Fast, Slow, and Non-Moving goods. In this article, we will be discuss an inventory analysis technique called the FSN technique that helps you identify the fast-moving, slow-moving, and non-moving products.
By the end of the article, you will have insight into:
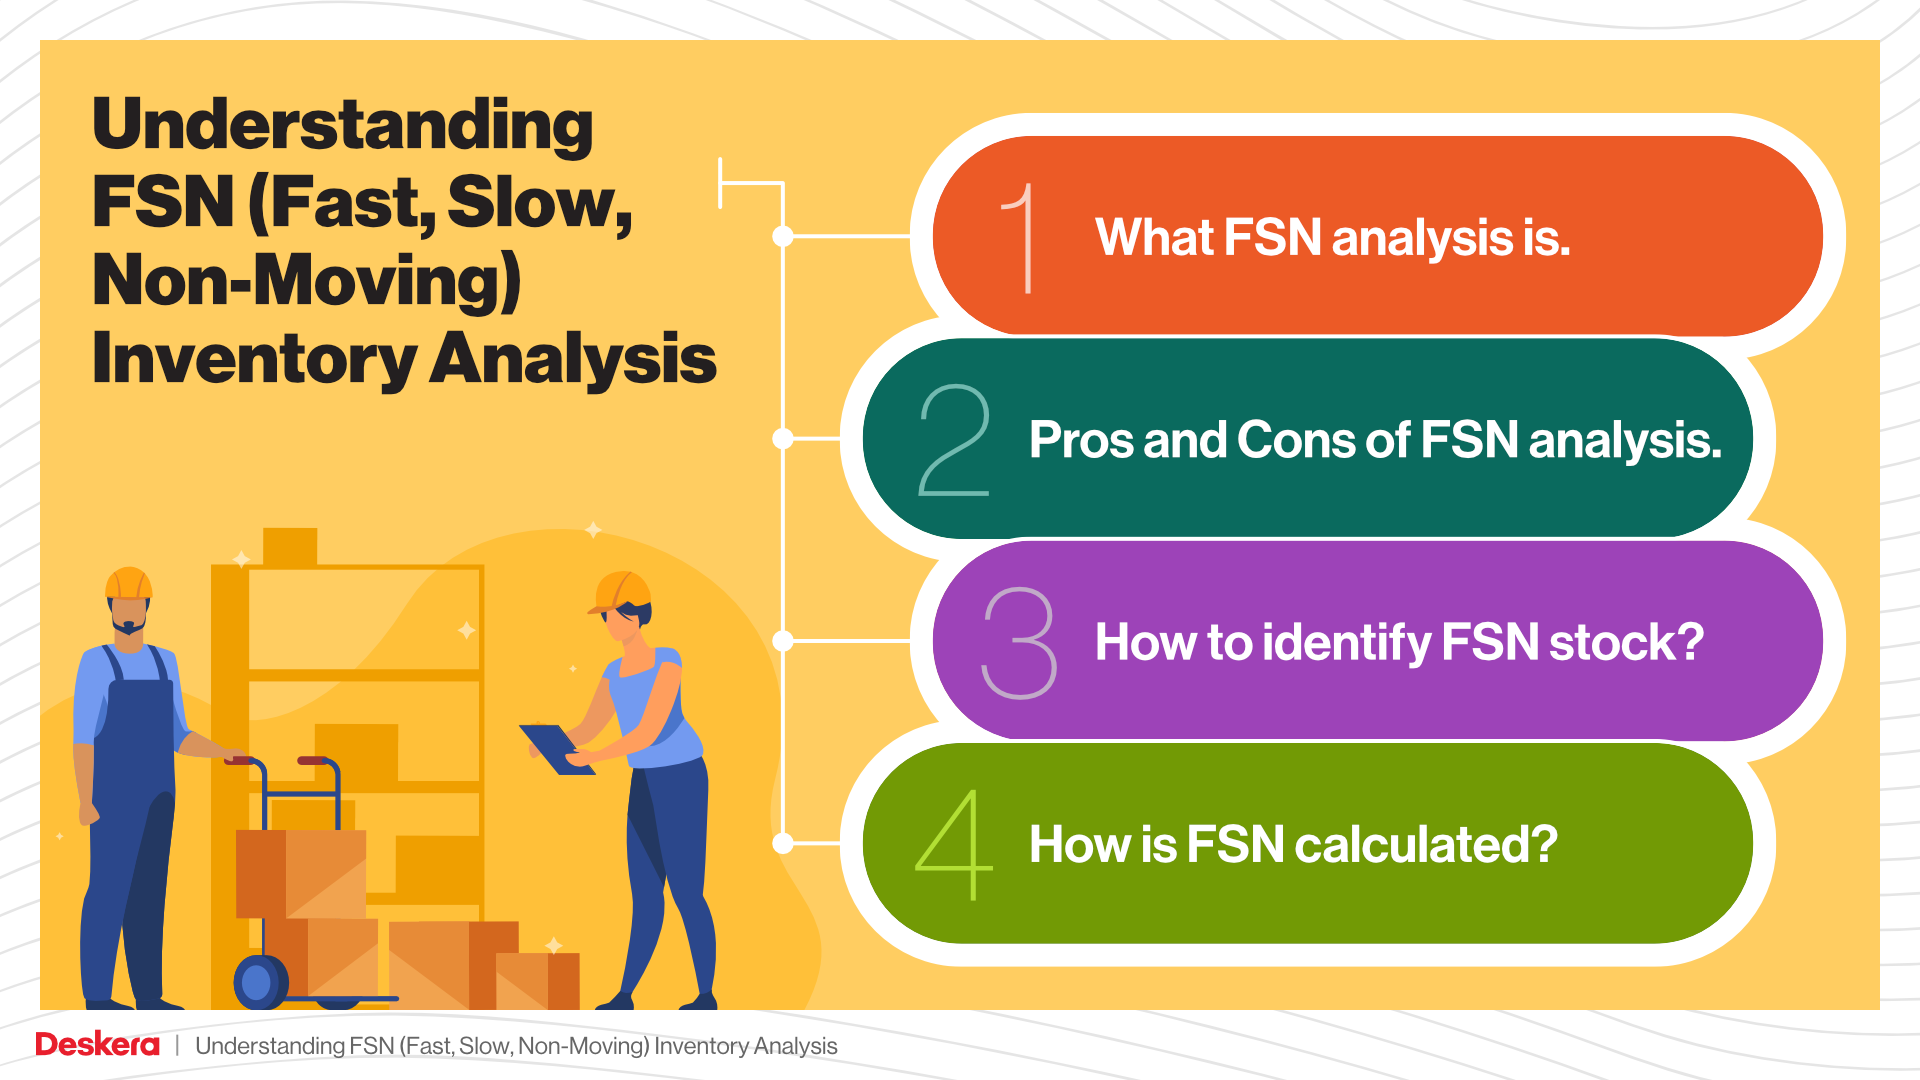
- What FSN analysis is.
- Pros and Cons of FSN analysis.
- How to identify FSN stock?
- How is FSN calculated?
Before we learn what FSN analysis in inventory control is, let’s take a look at what FSN in itself means.
What is FSN?
Fast-moving goods are the items in your stock that are utilized regularly. There are usually basic day to day items that are used by customers on a regular basis. There can fast moving and need to be produced on regular basis. Fast moving goods usually have a low profit margin. They are non-durable and sell at relatively low cost. Examples, include milk, eggs, fruit and vegetables and over-the-counter drugs like paracetamol and asprin.
Fast-moving consumer goods have a high turnover rate and is also very competitive. Some of the world's largest companies compete for market share in this industry including Coca-Cola, Unilever, Procter & Gamble, Nestlé, PepsiCo, etc.

On the other hand, slow-moving goods are only used for a particular timeframe. Slow moving inventory is defined as stock keeping units (SKUs) that have not shipped in a certain amount of time, such as 90 or 180 days, and merchandise that has a low turn rate relative to the quantity on hand. Slow moving goods can be problematic and can contribute to waste of capital and resources.
Non-moving goods are not utilized at all over a specific timeframe and has a turnover rate below one. These are goods that are stocked up over a long period of time. Now let’s find out what the inventory control method, FSN analysis is.
What is FSN analysis?
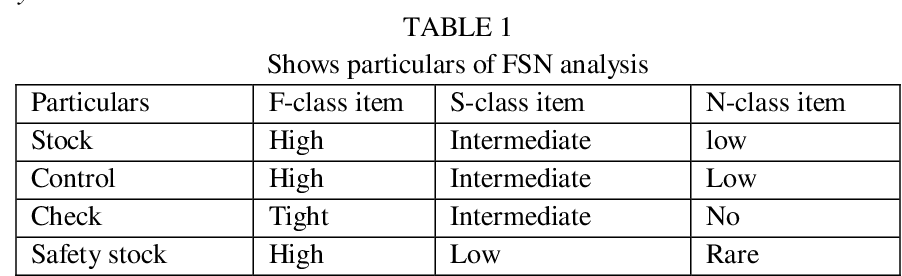
The fast-moving, slow-moving, and non-moving inventory control method is classifying the goods/products based on the following parameters. The FSN analysis segregates products based on their consumption rate, quantity, and the rate at which the inventory is used. The FSN analysis is based on the following parameters mentioned below:
- The consumption rate of a product: The average quantity of an item consumed or expended during a given time interval.
- The average stay in inventory: Reflects how long did a specific product take to get sold in a given period.
- Period of analysis: Define when you are conducting the analysis, in a year, 6 months, etc.
For FSN analysis, the inventory turnover ratio (ITR) for each product should also be calculated because the product is classified based on the ITR they possess.
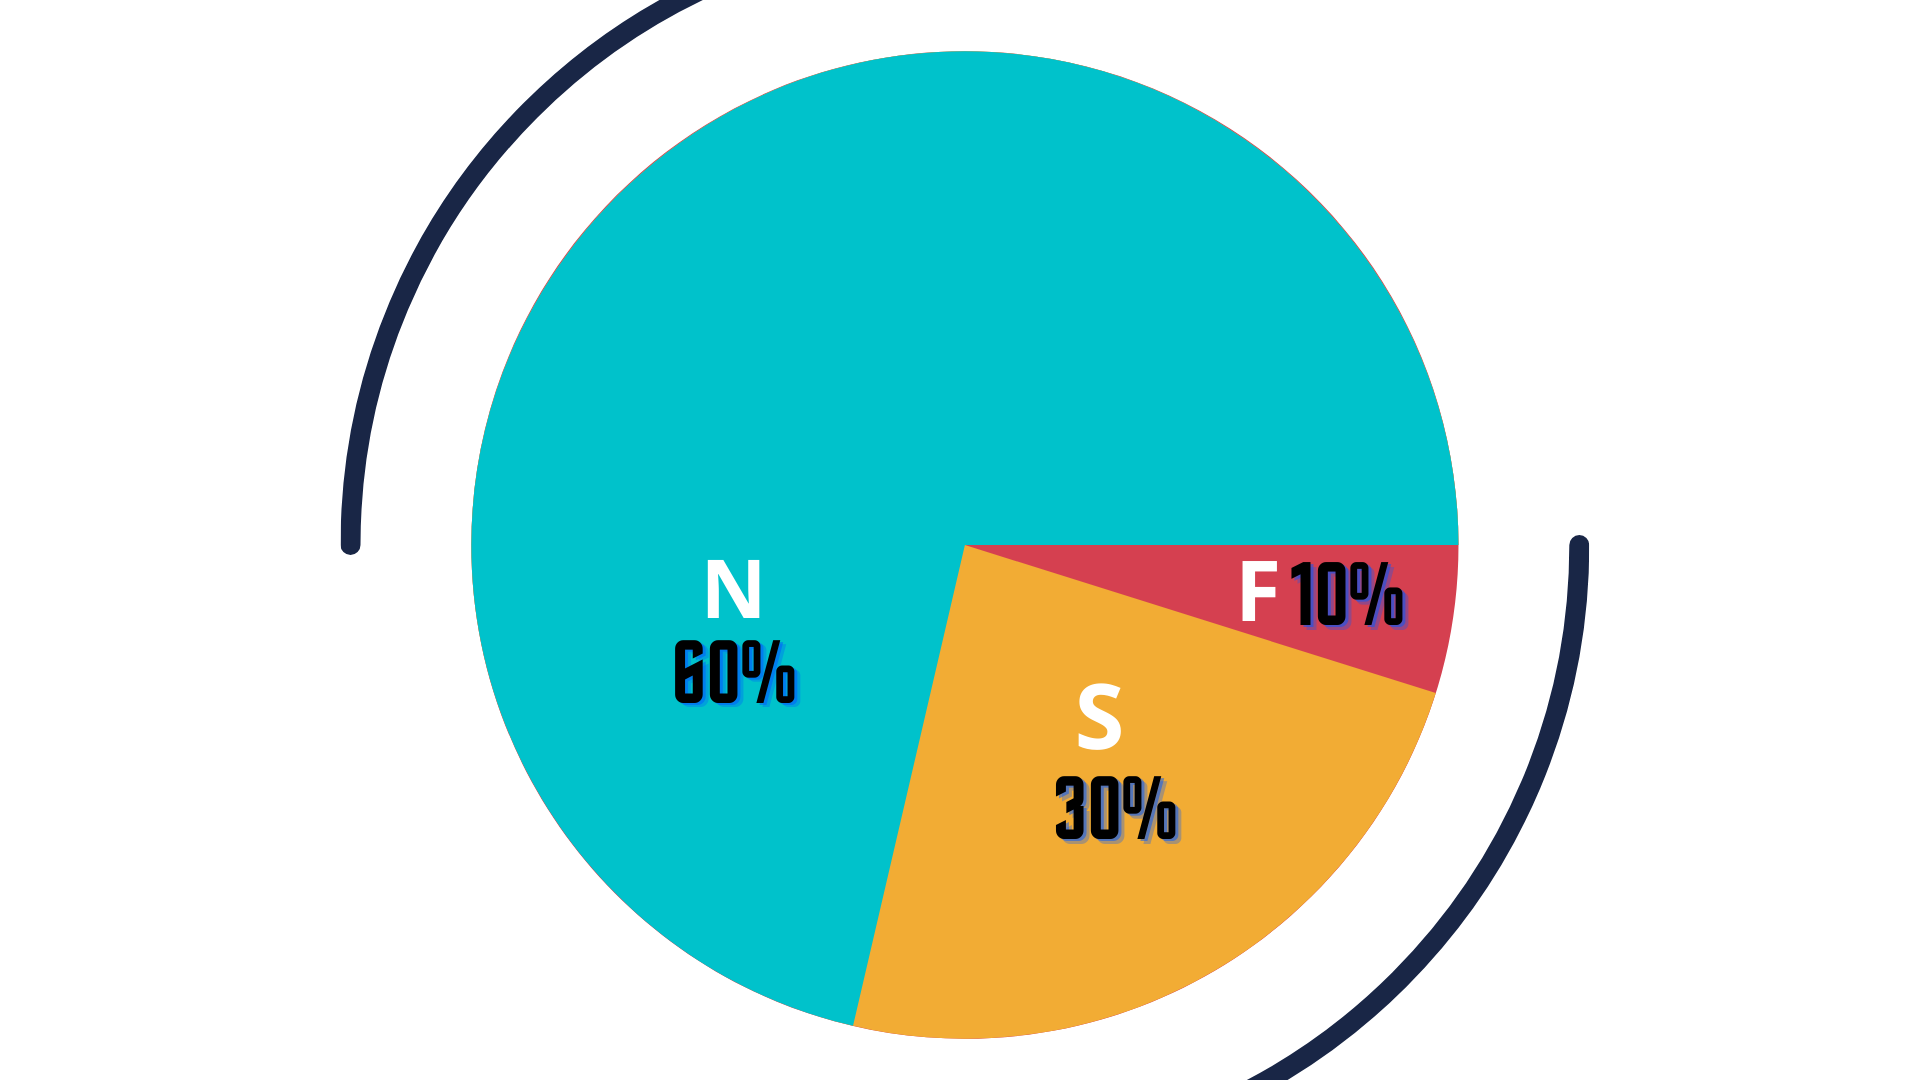
The inventory turnover ratio of fast-moving goods is more than 3 and accounts for approximately 10%-15% of the total inventory. Slow-moving goods often have an ITR of 1-3 and account for 30%-35% of the total stock. At the same time, the ITR of non-moving goods is below 1 and amounts to 60%-65% of the total inventory.
- Non- moving items constitute around 70% of the average cumulative stay
- Slow-moving stocks are 20% of the average cumulative stay
- Fast-moving products are 10% or less of the average cumulative stay
Fast-moving products stay only 10% or less of the average stay of the inventory and hence travels quickly through the supply chain.FSN analysis is an easy way to find dead stock and reduce its accumulation in the inventory. The FSN analysis technique empowers the retailers to decide on the future of the business of each product. it helps to decide if to increase the purchase of a particular product or to not.
FSN analysis helps get rid of the non-moving products at the correct time to avoid the inventory carrying cost. Doing this analysis will help you replace those products with the products that bring in the profits instead.
Now that you have understood what FSN analysis is, let’s find out the factors required to conduct the analysis.
How to Conduct FSN Analysis?
The FSN analysis comprises of the following basic steps:
Step 1: To figure out which product falls under which category you need to calculate the consumption rate of a product and the product’s average stay in inventory.
Formula to calculate average stay of a product:
Average stay = cumulative no. of inventory holding days [or unit of time] ÷ (total quantity of items received + opening balance)
For example, the cumulative number of inventory holding days for a branded paid of shoes is 40 days, and total quantity of items received is 10 with opening balance of 10.
Average stay= 40 ÷ 10 + 20
Average stay= 40÷ 30
Average stay= 1.33
Hence, average stay of the branded pair of shoes would be approximately 2.
Formula to calculate the consumption rate of a product:
Consumption rate = Total issue quantity ÷ Total duration
For example, the total issue quantity of another pair of shoes is 70 and the total duration is 10 days, then what will be the consumption rate?
Consumption rate = Total issue quantity ÷ Total duration
= 70 ÷ 10 =7
Hence, the consumption rate for the pair of shoes would be 7 units.
Step 2: Once you have calculated the average stay and consumption rate of the product, then calculate the cumulative average stay and cumulative consumption rate of the product. Don’t forget to derive the same in percentages.
Formula to calculate the cumulative average stay:
Cumulative average stay = average stay of item + average stays of all items that stay longer in inventory than itself
Formula to calculate the cumulative consumption rate:
Cumulative consumption rate = consumption rate of item + consumption rate of all items consumed faster than itself
Formula to calculate percentage average stay of a product:
Percentage average stay = (cumulative average stay of item ÷ cumulative average stay of all items) x 100
For example cumulative average stay of an item is 10 days and cumulative average stay of all items is 35.
Percentage average stay= (cumulative average stay of item ÷ cumulative average stay of all items) x 100
Percentage average stay= 10 ÷ 35 x 100
= 28.6%
Formula to calculate percentage consumption rate of a product:
Percentage consumption rate = (cumulative consumption rate of item ÷ cumulative consumption rate of all items) x 100
For example, cumulative consumption rate of item is 13 and cumulative consumption rate of all items is 10.
Percentage consumption rate = (cumulative consumption rate of item ÷ cumulative consumption rate of all items) x 100
Percentage consumption rate= 13 ÷ 10 x 100
= 130
Now, let us try to understand how to conduct FSN analysis with the help of an elaborate example.
List the items and calculate their unit cost, annual demand, and annual usage & arrange the items in the decreasing order of their annual demand
Calculate the percentage of annual demand & cumulative percentage of annual demand and classify inventory items into F, S & N, category.
Result of FSN analysis:
We hope you have understood how to conduct FSN analysis. But, still, confused, why should you practice it in your business?
To help you understand the importance of FSN analysis, we have collated several pros that you should not miss out on. As a bonus, we also have a few cons for you to look at so that you know all the Good, bad, and ugly of FSN analysis.
Pros & Cons of FSN Analysis
Let us weigh in on the pros and cons of FSN anaysis for inventory management:

Pros of FSN Analysis
The FSN classification helps you to shape decisions around the goods that are just sitting in your warehouse costing you money, and the ones that should be restocked frequently. Here are a few pros of FSN analysis you should make a note of.
- You no longer have to shoot in the dark and stock products randomly without being aware of their worth or their revenue rate. FSN is a simple method to identify deadstock, preventing you from stacking products that barely have any demand in the market.
- FSN analysis also enables you to decide on the budget of a particular product and the quantity that should be bought. As a result, it helps to avoid blocking money in slow-moving or non-moving goods.
- Helps you study the shifting trends in the market.
- Based on FSN analysis, you can keep the fast-moving goods closer to you in a warehouse that is easily accessible.
- FSN also helps in space management effectively. Slow-moving and non-moving categories of goods can be bought only in limited quantities to avoid jamming storage space.
- As we know, nothing interesting is ever completely one-sided, similarly, along with the pros, FSN analysis also comes with some cons that you should be aware of.
Cons of FSN Analysis
- One of the loopholes of FSN analysis is that it is solely dependent on the formulas, and the information that you have gathered about a product. If the information is faulty, the FSN analysis, as a result, would be inaccurate and faulty too. Since you will be managing your inventory based on FSN analysis, you cannot afford it to be faulty.
- Rapid changes in the market trend can also affect your FSN analysis. For example, if a product is in high demand and you have a decided time, date to restock it, and you see a sudden drop in the demand, your FSN calculations will fail.
The Bottom Line
In the present scenario of the market, companies want to maintain a balance between going out of stock and minimizing inventory costs. With the help of FSN, analysis companies can successfully find that balance and continue to grow their business.
You will be surprised to learn that, FSN analysis technique is not the only method available for inventory control. Just in Time (JIT) in inventory control, Economic Order Quantity (EOQ) method, and ABC analysis might also interest you if you are serious about inventory management in your company.
A good way to optimize your inventory management process is with the help of our Deskera software. It helps you to keep tabs on your inventory. You can always revisit the latest updates on your goods within a few taps within the software.

Get a 15 days free Deskera trial today to optimize your inventory management system.
If you found this article insightful you may also like to read: