Customer service is an essential and delicate function to manage. The everyday targets are as important as big picture goals, and just one simple miss can spiral down to multiple backlogs pretty quickly.

As a business where you deal with people, you are always one escalation and one bad review, one late response away from losing a customer for good. Here are the top 12 best customer service metrics and key performance indicators (KPIs) to evaluate your team's performance and set your team up for success from day one.
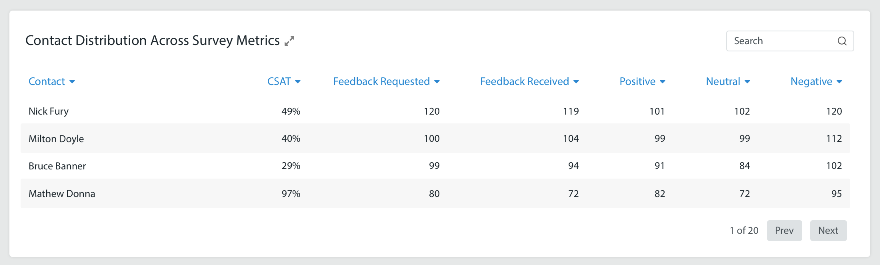
Customer Satisfaction (CSAT)
CSAT is short for Customer Satisfaction which is commonly used as a key performance indicator or customer service metrics to track how satisfied your customers are with your organisation’s services or products. You can measure customer satisfaction after each interaction with a customer service agent. The CSAT ratings can be measured overtime to analyse how certain teams or agents are performing.
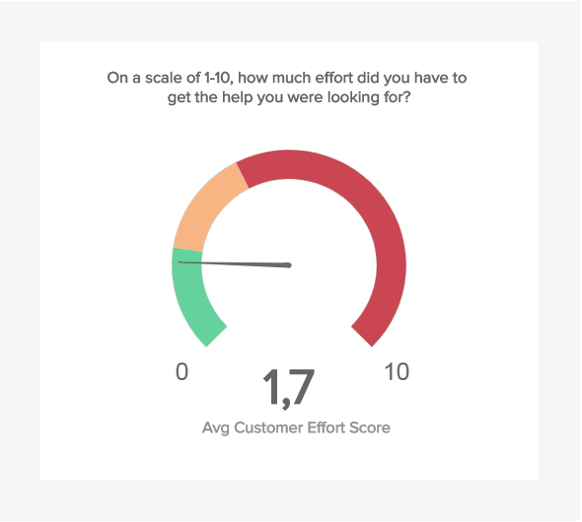
Customer Effort Score (CES)
Customer effort score or CES is a single item metric that measures the amount of effort a customer has to exert inorder to get an issue resolved or a request fulfilled or a product purchased/returned or even a question answered. The idea of CES is that the customer will be more loyal to brands which are easier to do business with. You can create a better experience for your customer by focusing on reducing customer effort. Customer effort score is one of the top customer service metrics used.
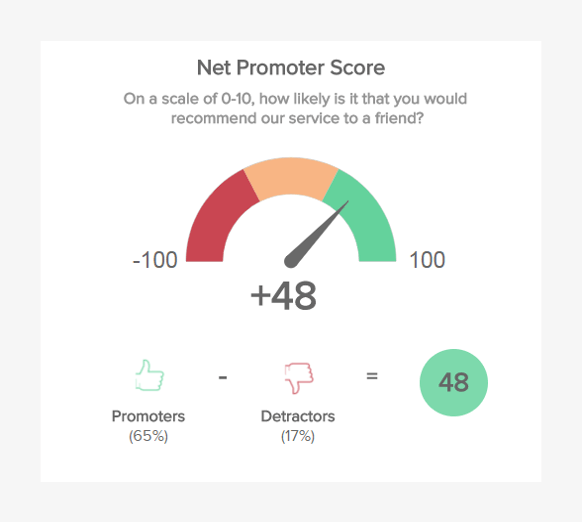
Net Promoter Score (NPS)
NPS stands for the Net Promoter Score which is a customer service metric used to measure customer experience programs. NPS is held up as the standard customer experience metric. Net Promotor Score is measured with a single question survey and reported with a number from 0-100, a higher score is desirable. Customers are bucketed into promoters with score of 9 or 10, passive score of 7 or 8, and detractors with score of 0-6. This will allow you to gain a bigger picture of customer loyalty.
Social Media Monitoring
Social media is a way customer connect with your brand. Customers voice both their praises and frustration on social media, yet very few brands embrace it and respond back. This can create a frustrating and one-way experience for the consumer. By tracking social media metrics, you will know when to respond to a customer and their issues. You will understand the types of questions that are being asked by your customer so that you can put in better systems in place to address the issues.
Top customer service metrics to track include:
- negative comments
- brand mentions over time
- the number of questions that could be answered through other support material
- technical or account questions
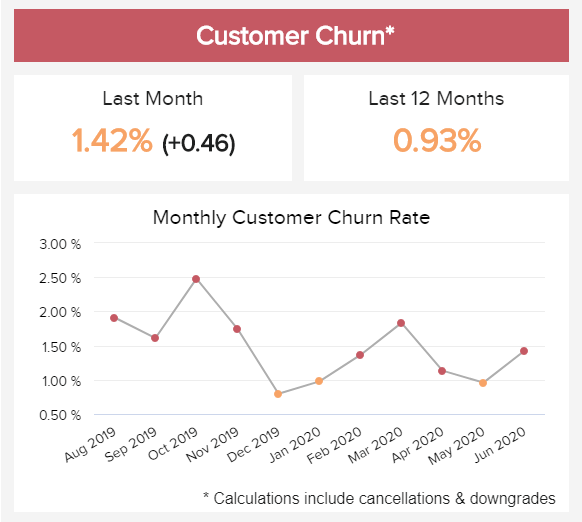
Customer Churn
Customer churn is also known as the customer attrition. Customer churn is also used as a customer service metrics. It is the most basic form of customer churn is when a customer chooses to stop using your services or products. This is trickier to measure since there are multiple predictors of churn. You must look at both operational insights like reduced purchase amounts, declining repeat purchases as well as experience insights along the customer journey to predict churn. For example, a customer who has had a fewer recent visits gets a Net Promoter Score of 6 after their latest shopping experience. This score means the customer has an increased probability of churning.
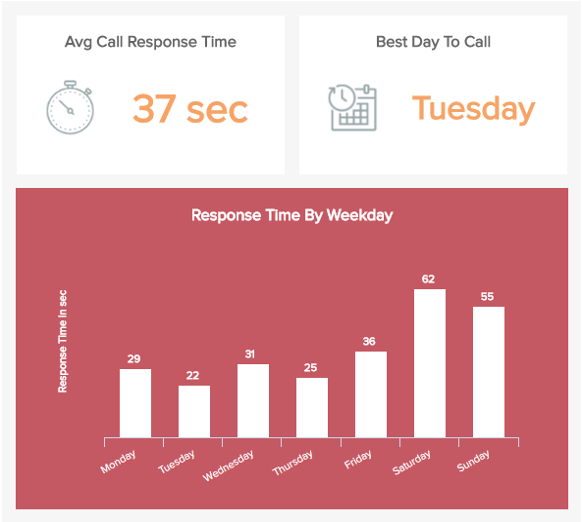
First Response Time
Most consumers say that valuing their time is the most important thing a company can do to provide a good customer experience. Hence, the first response time is used as a customer service metrics. When a customer reaches out with concern or question, they want a fast reply from an actual human. While it is beneficial to send an automated reply that someone will be in touch, it does not count as a reply until one of your team member has personally responded. Your first response time should be faster than the industry benchmarks. You can start by using these as a starting point:
- Live chat and messaging- Instant
- Email or online form in 24 hours or less
- Phone- 3 minutes
- Social media- 60 minutes
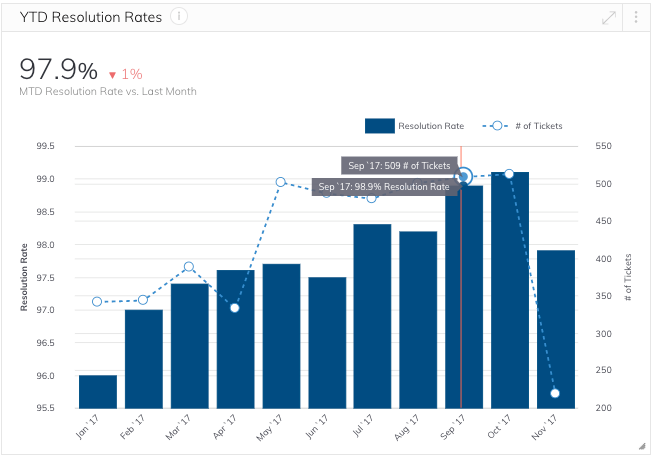
Overall Resolution Rate
When your customer has a complaint or question, your goal is to resolve the issue and close the loop. If you do not respond or can't provide adequate support, the customer may be hesitant to do business with you again. Rising the resolution rates can indicate the effectiveness of your customer support team. You can use resolution rate as a customer service metrics.
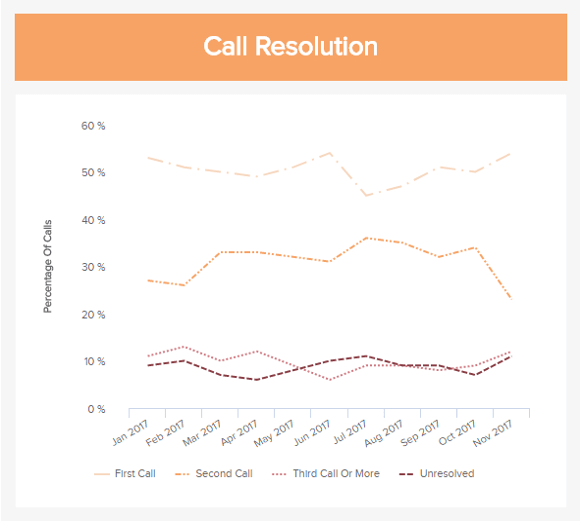
First Contact Resolution Rate
Customers do not like to be bounced around from one agent to another and want their issues to be resolved on the very first and the initial point of contact. The first contact resolution rate measures how many cases require just one contact from your customer. A good first contact resolution rate, likely correlates with CES because the customer needs to make less effort if they have to only contact your organisation once.
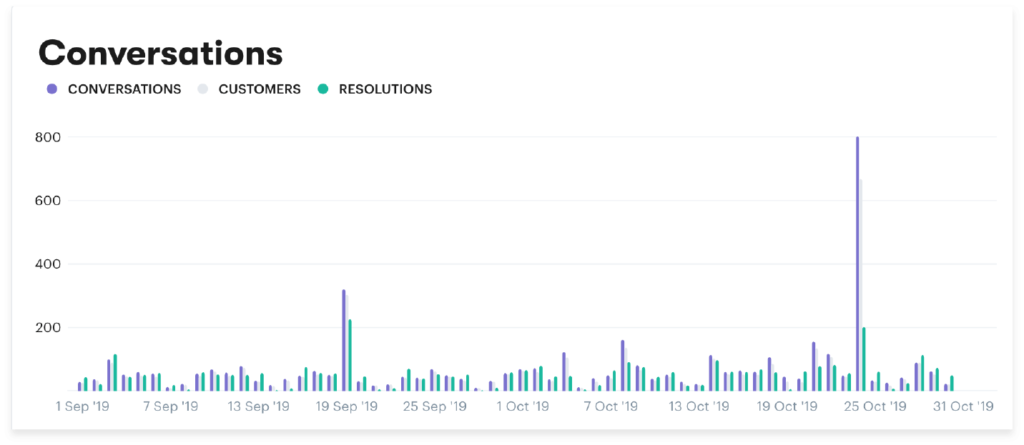
Customer Ticket Request Volume
It's good that the customers are interacting with your business and you have an accessible ticketing system. However, getting too many requests can indicate an issue. If you have a large amount of tickets, you either need to hire more customer support agents and look into a potential problem with your UX or UI. You could also try updating your organic support articles so customers can get help on their own. Keeping track of this customer service metrics is quick and easy to do.
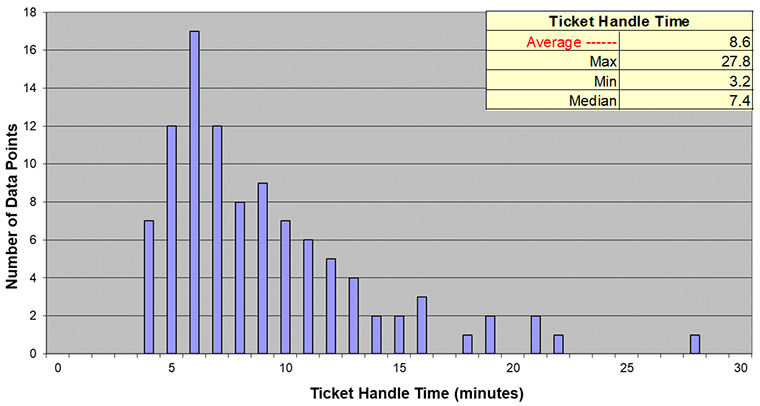
Average Ticket Handling Time
The average handling time measures the amount of time an agent spends working on a single case. The shorter the average handling time, the more efficient your team is. It is important to not focus on this solely because agents may rush through customer tickets instead of focusing on great customer service.
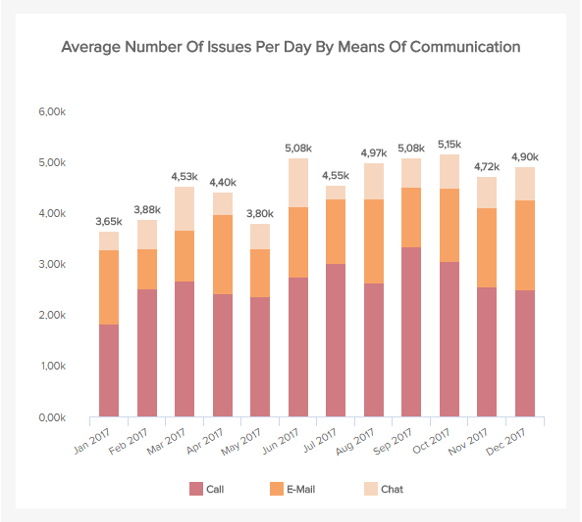
Average Number of Queries Handled
The average number of queries handled per day is an effective customer service metrics indicator of your support team's capacity. Measuring the individual team member's performance gives you the insight into how many queries everyone can handle while maintaining the quality of customer satisfaction. Too many backlogs could mean you need to hire more people or even provide additional training to your customer service team for better resolution time.
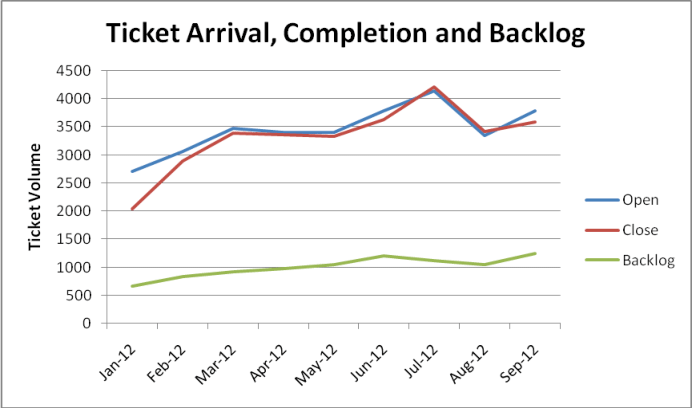
Ticket Backlog
Ticket backlog is a customer service metrics keeps track of the number of unresolved support tickets at a given time period. These queries usually exceed the typical resolution time due to any or all of the following reasons ticket volume spike, complexity or any unexpected dip in the team performance. These backlogs also indicate the gap between reality vs target. If your customer service team continuously faces a constant ticket backlog, it is either time to address your staffing needs or assess your team’s performance.
Key Takeaways
Customer service metrics alone will not produce satisfied customers. It is up to you to take these data points and build a customer service experience that works for your organization. Tracking these above mentioned customer service metrics will help you unlock the power in your data and ensure you are continuously offering a high-quality service for your customers.
- Customer Satisfaction (CSAT)
- Customer Effort Score (CES)
- Net Promoter Score (NPS)
- Social Media Monitoring
- Customer Churn
- First Response Time
- Overall Resolution Rate
- First Contact Resolution Rate
- Customer Ticket Request Volume
- Average Ticket Handling Time
- Average Number of Queries Handled
- Ticket Backlog