
Are you at a point in your business where you feel you need to re-allocate your resources to perform better? To achieve all your marketing objectives, net profit goals and solve all your customer’s pain points in the best possible way, understanding the areas where your business is doing exceptionally well and the areas where it can do better is very important.

This is where business metrics come into play. By using the right business metrics, you would be able to meticulously measure and track the operational performance of your business.
By tracking your business metrics, you would be able to allocate your resources wisely and strategically while also ensuring the success of your business. In fact, business metrics would become your guiding light, ensuring that your business is working in the right direction.
By using the relevant business metrics, you would even be able to make key decisions related to investments, finance, marketing, human resources, sales, and any other such relevant business operations. This will help you in building a successful business with successful products and services and customers that are happy.
Hence, business metrics display a measurable value that shows the progress of your company’s business goals, and this article like guide will take you through the basics of business metrics as well as the 35 business metrics that should be tracked by each company.
What are Business Metrics?
Business metrics are quantifiable measures used to track business processes to judge the performance level of your business.
It would be on the basis of these business metrics that you would be able to assess whether your business’s certain process is a success or a failure.
Each department of your business will track, monitor, and analyze its own performance through its key metrics. For instance, the key business metrics of your sales department might be sales volume and sales call, the key business metrics of your marketing department might be engagement, campaign costs, website traffic, and the key business metrics for the senior executives of your business like CFOs might be net sales, operating expenses, operating profit and so on.
Hence, business metrics help make effective decisions while also addressing all of your business’s stakeholders like customers, managers, business owners, investors, executives, and vendors. Henceforth, business metrics give you an insight into your business before you dive deep into its core data.
Benefits of Tracking Business Metrics
One of the key benefits of tracking your business metrics is that it will maximize your business’s chances of success because you will be managing your business’s operations based on the results and what your business’s metrics indicate.
However, to get this benefit for your own business, you will have to choose business metrics that are most relevant to your business and then track, monitor, and analyze them.
Thus, the six benefits of tracking your business metrics are:
- Performance Improvement: By tracking all the relevant and important business metrics, you would be able to gauge how well or badly your business is performing. The business metrics will also show you how to improve your business’s operations.
- Comparative Analysis: By tracking your decided business metrics and comparing them against your industry’s benchmarks, you would also be able to determine whether your business is over-performing or under-performing.
- Better Decision Making: By looking at actual business metrics and their data and analysis while making your decisions, you would be able to ensure that you are in a better position to make decisions that will promote the health and well-being of your company and its customers. Your decisions would no longer be based on personal bias but rather on objective reasoning.
- Alignment: Business metrics are also useful in ensuring that your entire company is working towards achieving the same organizational goals.
- Compliance: Some of the business metrics are tracked because they are part of mandatory requirements by a governing or regulatory body. Hence, by tracking those business metrics, you would be able to make sure that your company is complying with all the rules and regulations.
- Communication: Reporting your decided business metrics is a vital tool of communication for your customers, shareholders, investors, employees, executive officers, and even for society at large.
- Identification of Problems: By analyzing your business metrics, you would be able to identify emerging problems in your business and therefore be able to rectify them before they become major issues or challenges for your business.
Key Difference Between Business Metrics and Key Performance Indicators
The key difference between business metrics and key performance indicators is that while business metrics are used for tracking all aspects and areas of your business, key performance indicators target only the critical areas of performance.
For example, while a business metric may be monitoring website traffic with your goal for it, a key performance indicator would be monitoring how website traffic contributed to increased sales.
Which Business Metrics Should You Use?
There are several business metrics to choose from that which ones you should use and focus on becomes a vital decision. While every business and its goals are different, and therefore the metrics that will matter to them will differ as well, the following four questions will help you identify what is most important to your business:
- Is a said business metric directly relevant to the performance of your business?
- Will the said business metric help you predict future performance in a useful way?
- Can that business metric be measured reasonably?
- Can the business team associated with the said business metric impact it, and are they even authorized to do so?
In addition to these, what also matters is:
- Type of your business
- The industry that your business is a part of
- Departments of your business
- Size of your business
- Business metrics followed the most by your competitors
Based on these factors and the answer to the above questions, you would be able to choose the business metrics that would be most relevant and useful to your business.
35 Key Business Metrics that Your Business Should Track
One of the most basic steps here is to identify these key business metrics for your business. It is only after you have fulfilled this step that you will be able to track, monitor, and analyze these business metrics. However, let us go through 35 key business metrics that your business should most preferably track:
Sales Metrics to Track
Sales business metrics are those that measure and evaluate sales-related performance and activities of an individual, team, or your entire company for a given period of time like weekly, monthly, quarterly, annually.
By using sales metrics, you would be able to monitor your sales as well as be able to identify what is and is not working and how you can improve your sales performance. Some of the key business metrics to track your sales are:
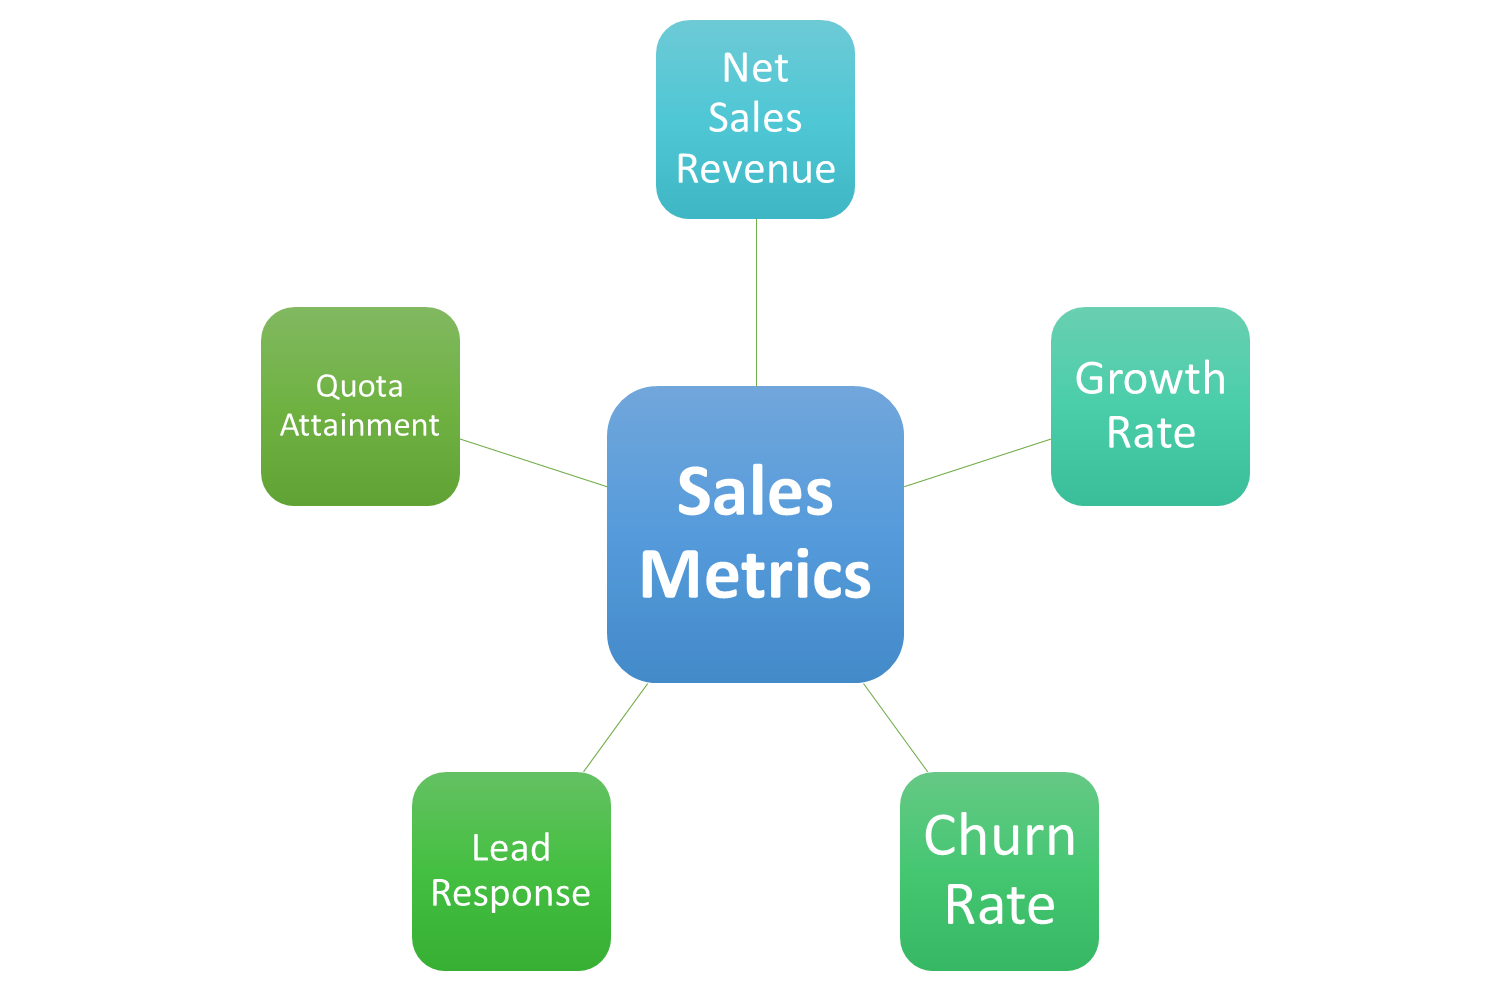
Net Sales Revenue
Revenue is the lifeline of your business, and net sales revenue is that business metric that tracks every aspect of business development, including sales. Depending on the maturity as well as the size of your business, there are several sales revenue metrics that you can track. These are:
- Annual recurring revenue which arises from multiyear contracts
- Average revenue generated per customer or user
- Revenue of each product or product line or service offered by your business
- Revenue calculated for each territory or market
- Revenue generated by each of your sales representatives
And then, you should track your net sales revenue. The formula for calculating your business's net sales is:
Net Sales = Gross Sales - Discounts - Returns - Costs Associated with discounts and returns
Growth Rate
Calculating your year-over-year growth is an important overall indicator of the health of your business. Especially when compared with your industry’s benchmarks, this business metric will tell you how well or poorly your sales team has performed in comparison to your competitors.
The formula for calculating your business’s sales growth rate is:
Sales Growth Rate = (Current year revenue - Previous year revenue) / Previous year revenue x 100
Hence , if your sales were $10 million this year and $9 million last year, then your growth rate would be = ($10 - $9) / ($9) x 100 = 11.11%
If your sales team has performed poorly in comparison to your competitors, then you would need to find ways to motivate your sales team, help them manage their workplace stress, and help them achieve their sales target.
The various measures that you can undertake for helping them achieve their sales target are launching competition sales and sales compensation plans, training them on how they can close deals faster using various sales strategies, and even launching better marketing campaigns to get higher quality leads.
Churn Rate
Churn rate as a business metric measures the percentage of customers who canceled or did not renew their subscriptions or contract for your business’s products or services. Churn rate is an important business metric because it measures performance across various business departments. These are:
- For the sales department, it reflects your sales team's ability to retain customers.
- For the finance department, it is important because your business’s chief executive tracks this business metric in order to be able to predict how the churn rate will affect your company’s sales and profits.
- If yours is a SaaS business, then the churn rate which shows rising or falling subscribers is also indicative of how your revenue is going to be affected.
- For the marketing department, churn rate will help in evaluating which marketing channels and marketing strategies performed well or did not perform well.
Hence, if your churn rate is rising, then it indicates that your business’s products or services are unable to address your customer’s pain points and therefore has failed in encouraging returning customers as well as in encouraging customer loyalty.
Additionally, it might also be indicative of you following a wrong customer service approach as per your target audience or that your marketing plan has several loopholes that need to be addressed.
A rising churn rate means you are losing your customers to your competitors, and therefore calculating it is vital. The formula for the same is:
Churn Rate = Number of customers lost during the period / Starting number of customers at the beginning of the period x 100
For example, if in quadrant 3, your company begins with 5,000 customers but ends with 4,000 customers, then the difference of 1,000 in the number of customers indicates a 20% churn rate.
Lead Response
Through lead response time, you would be able to assess how long it takes your sales representatives to contact a new lead. Lead response time is often a crucial business metric because, in certain industries, the quicker the salesperson responds to a sales prospect’s inquiry, the more engaged the sales prospect will get, thereby increasing the chances of getting that sale. Lead response time hence can also help you predict how you can increase your sales and therefore improve your cash flow.
The formula for calculating lead response time is:
Lead Response Time = Sum of time between lead contact to sales representative response for all contacts / Total number of leads.
For example, if one of your sales representatives is given 9 leads and is able to respond to 5 leads within 1 day, 3 leads within 2 days, and 1 lead in 3 days, then your lead response time is:
(5 x 1 + 3 x 2 + 1 x 3) / 9 = 1.55 days
Quota Attainment
Just like there are several business metrics that help you in assessing whether you achieved your sales goals or not, quota attainment is one of the most universal metrics you can choose for your business.
The importance of this business metric is that the key to increasing the number of your sales representatives reaching their quotas is by first finding out how many already do. This will help you figure out where you should concentrate your efforts, like teaching your sales representatives different sales strategies or updating your sales pricing strategy if a certain representative who handles a specific product is facing challenges in meeting their sales quota, and so on.
This business metric is also important when you are looking forward to increasing sales in a specific region or market. Here, your company’s performance can be monitored by this business metric, whose formula is:
Quota Attainment = Amount of sales achieved by a particular representative or region / Goal for that representative or region.
For example, if the goal for one of your sales representatives is $10 million and your sales representative was able to achieve $9 million in sales, then the quota attainment here is 90%.
Marketing Metrics to Track
There are several varied ways by which you can market your business’s products or services that figuring out the combination which works the best is crucial.
Some of the various types of marketing that your business can engage in are performance marketing, retargeting marketing, content marketing, SEM marketing, Instagram marketing, Facebook marketing, YouTube marketing, organic marketing, sustainable marketing, email marketing, brand marketing, and many more.
In fact, some of the elements that you can use during these marketing campaigns involve but are not limited to CTAs, landing pages, lead magnets, conversion rate optimized forms, etc.
Hence by using the insights provided by different marketing metrics, your business would be able to identify the marketing channels, campaigns, and marketing tools that support your business’s success in the best possible way. Some of the key marketing metrics that your business should track are:
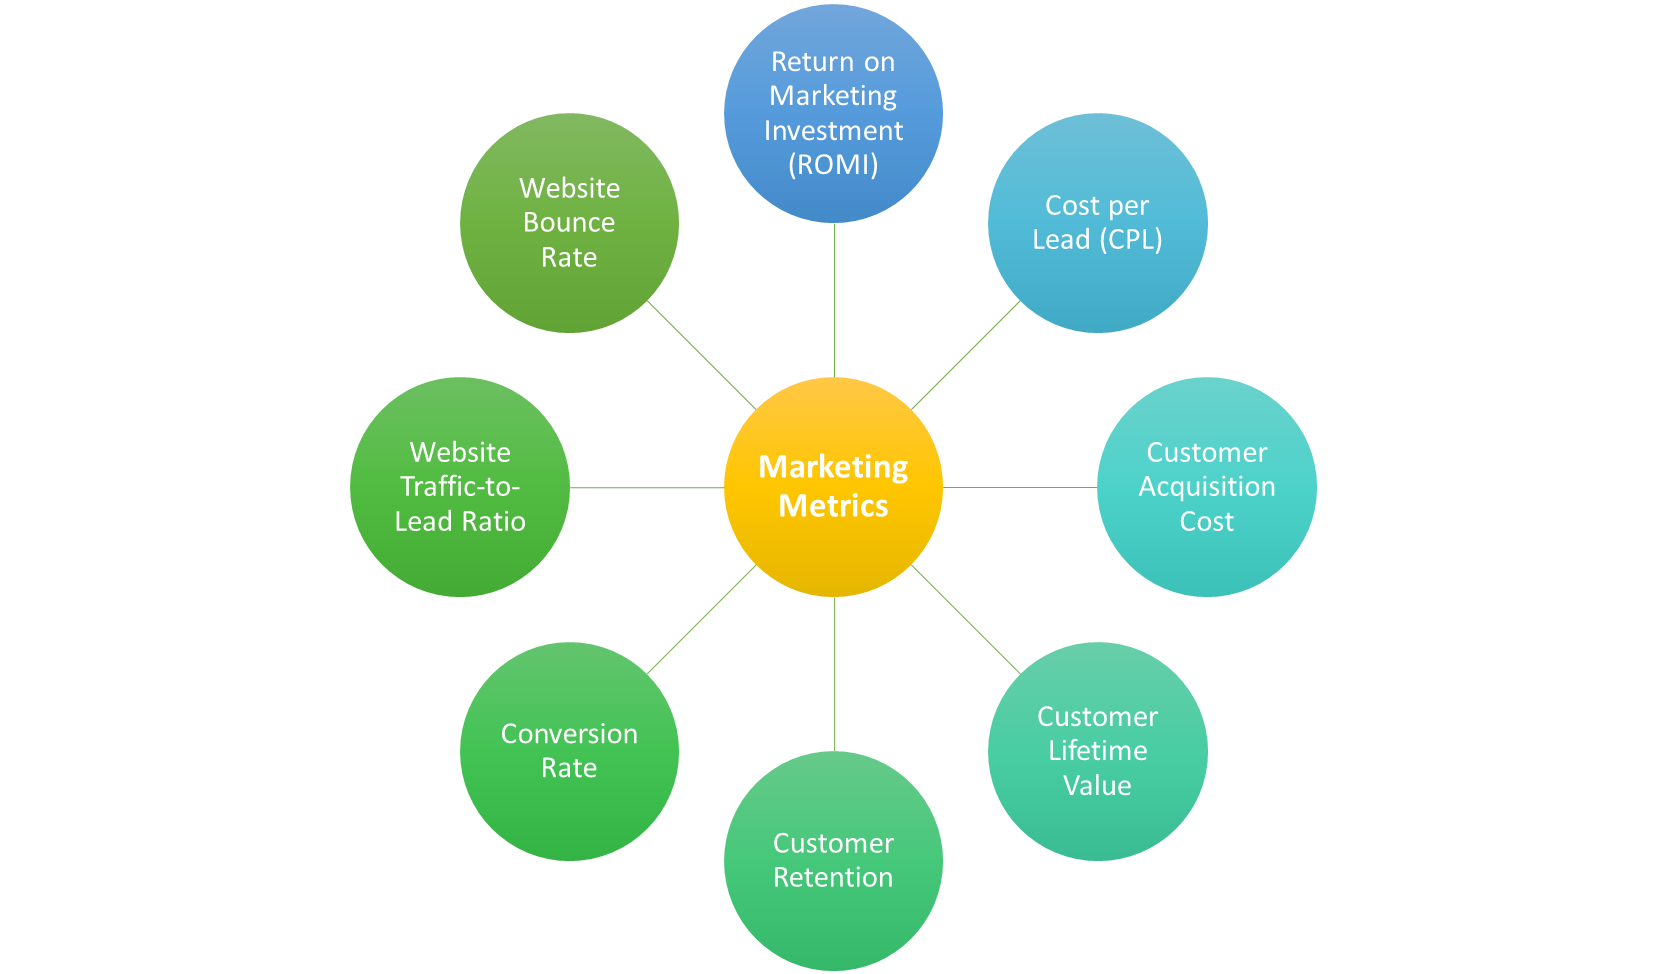
Return on Marketing Investment (ROMI)
ROMI is different and harder to calculate than most of the other return on investment metrics. This is because ROMI focuses on the profits of incremental sales that can be attributed to marketing activity- i.e., the profit generated by your business’s marketing department.
ROMI can be calculated separately for each of your marketing and advertising channels. The importance of ROMI lies in the fact that it will provide you with insights into the value of your marketing activities in general. Additionally, it will also help you differentiate and assess the relative performance of your different marketing channels and campaigns.
The formula for calculating ROMI is:
Return on Marketing Investment = (Sales growth - Marketing Cost) / Marketing Investment x 100
For example, you have invested $20,000 in an email marketing campaign which has generated $120,000 in sales at a 20% profit margin. It has thus contributed $12,000 to your business’s profit. Your ROMI for this marketing campaign would be = (120,000 x 0.20 - 20,000) / 20,000 x 100 = 20%
Cost per Lead (CPL)
This business metric calculates the total cost incurred for identifying, attracting, qualifying, and retaining a customer. The importance of knowing your cost per lead is that on the basis of it, you would be able to allocate your budget appropriately. However, this decision should not be based only on the CPL of a particular channel.
This is because even if a particular channel is incurring higher CPL, its customers might be converting at a higher rate, or they might be spending more than the customers gained from lower CPL-channel. Thus, just high CPL should not be the basis on which you drop a channel. These other factors are equally important.
The formula for calculating CPL or cost per lead is:
Cost per lead = Total marketing spend / Number of new leads
Customer Acquisition Cost
Customer acquisition cost, or CAC, is a business metric that calculates the cost incurred to turn a prospect into a customer. CAC takes into account all the marketing and sales costs which hence includes everything- from salaries and benefits of the staff till the advertising spend.
CAC is best calculated during a period of time where your business has peaks and valleys. For this reason, a year is the standard time period for calculating your CAC. the formula for calculating CAC is:
Customer Acquisition Cost (CAC) = Total marketing and sales spend / Number of new customers.
For example, if you invest $2 million in marketing and sales and from it get 1000 new customers, then your CAC is $2,000,000 / 1000 = $2,000 per customer.
Customer Lifetime Value (CLTV)
Knowing your CAC will hold little meaning if you do not know the worth of each of your customers. This is where the business metric CLTV comes into the picture because CLTV measures what will be the profit earned from a customer over the entire time if they continue to remain a customer of your business.
However, you do not want to track the values of only individual customers, but rather an average of all the customers or of the customers in a particular customer group.
This varies from company to company as some would add value from customer references or from recurring revenue as well. Customer references basically lead to sales referral and help you to reduce your CAC and simultaneously increase your CLTV.
The formula for calculating CLTV is:
Customer lifetime value = (Average transaction value x Average number of transactions in a year x Average customer retention in years) x Profit margin.
For example, your company’s overall profit margin is 20%, and on average, it retains its customers for five years. The average transaction value is $100, and each of your customers makes ten purchases per year. In this case, your CLTV would be = (100 x 10 x 5) x 0.20 = $1,000.
Customer Retention
Knowing how expensive it is to acquire new customers brings to focus the importance of retaining the customers that you already have. Customer retention is the percentage of existing customers that stay during a specific time period. The formula for calculating your business’s customer retention is:
Customer Retention = (Number of customers at the end of a period - Customers added during the period) / Number of customers at the beginning of the period.
For example, if your company had 1000 customers at the start of the year, added 100 customers during the year, and ended the year with 1000 total customers, then your customer retention rate is = 1000 - 100 / 1000 = 0.9 and as we want the percentage, 0.9 x 100 = 90%
Conversion Rate
This business metric is a way to measure the percentage of users or customer prospects who completed the desired action like opting for a free trial, making an account, making a purchase from you, etc.
By tracking this business metric, you would be able to get insights on how well or not well your marketing strategy is working. In fact, once you get the insights from this metric, you would even be able to undertake ways that will lead to conversion rate optimization of your business’s marketing efforts.
The formula for calculating your conversion rate is:
Conversion Rate = (Conversions / Total Unique Visitors) x 100
For example, you have a subscription-based business, and you have offered a free trial to 2,500 potential customers in total. Out of that, only 500 decided to take advantage of it. Your conversion rate here is = (500 / 2,500) x 100 = 20%
Website Traffic-to-Lead Ratio
A sales qualified lead (SQL) from your website is someone that is not only aware of your company but interested enough to enter their information on the website in order to, for example, get past a filter or to get to your newsletter or template or eBook, etc.
The formula for calculating website traffic-to-lead ratio is:
Website Traffic-to-Lead Ratio = Number of leads / Number of unique website visitors
For example, if your business’s website is visited by 250,000 individuals in a month, 2,500 of whom convert to leads, then your traffic to lead ratio is 1%.
Website Bounce Rate
Just like conversion rate, website bounce rate is a business metric that will be able to help you in tracking the effectiveness of your marketing strategies. Website bounce rate calculates how well or not well your website’s landing page is able to grab your visitor’s interest.
It does so by calculating the percentage of visitors who come to your website and leave without viewing other pages within your website. The formula for calculating your website’s bounce rate is:
Bounce Rate = (Number of site visits that access only one page / Total number of site visits) x 100
For example, if your website has 100,000 visitors and 50,000 of them view only one page, then your bounce rate is (50,000 / 100,000) x 100 = 50%
Remember, the higher is your bounce rate, the lesser your website is being able to engage your customers’ interest. This is why a low bounce rate is ideal.
Financial Metrics to Track
For the finance teams of your company, those business metrics which reflect the financial health of your business are the most important ones. This is because your company’s survival depends on its financial health, as shown by financial metrics, financial KPIs, and financial statements.
Most of the financial metrics take into account factors like revenue, cash flow, account receivables, assets, and liabilities. Some of the key financial metrics that your business should track are:
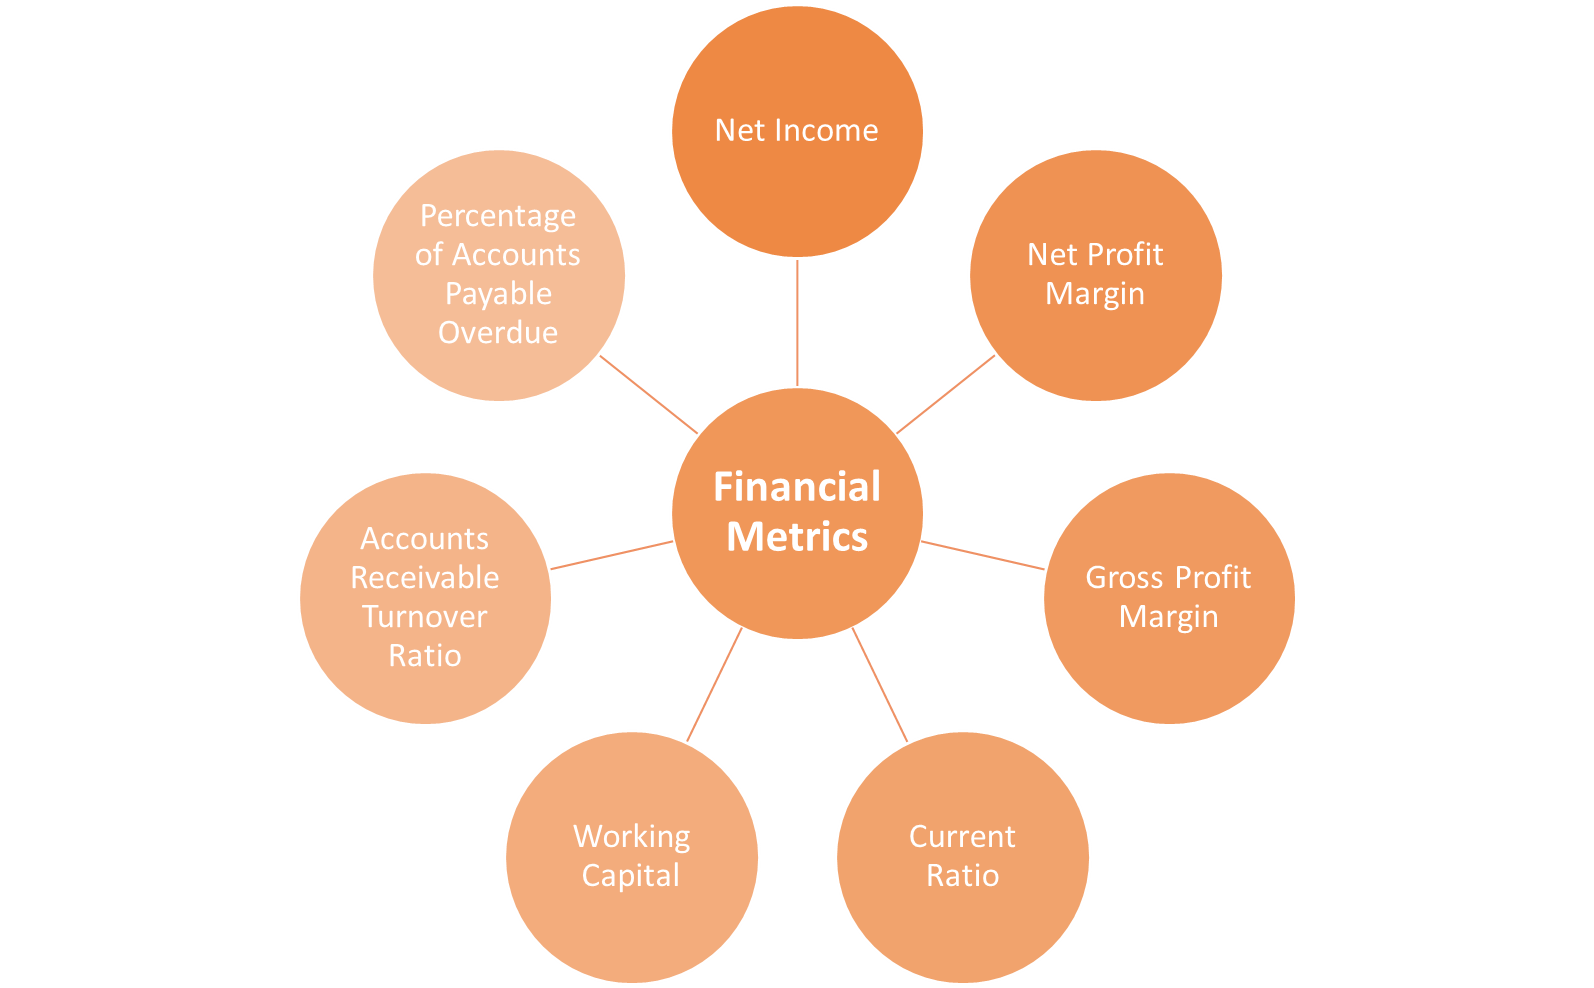
Net Income
Net income tends to be every business’s biggest financial concern. Additionally, net income is that business metric that is the starting point for calculating other key financial metrics like net profit margin and earnings per share.
Net income generally appears at the bottom line of your company’s income statement because it reflects your business’s total expenses subtracted from its total revenue. Net income hence also helps in assessing whether or not your expenses are exceeding your revenue, and if so, by how much.
The formula for calculating your net income is:
Net Income = Total revenue - Cost of goods sold - Operating expenses - Other expenses - Interest - Taxes - Depreciation and Amortization
What needs to be taken care of here is that net income is different from gross income because gross income only subtracts the cost of goods or services sold from your total revenue.
Net Profit Margin
Net profit margin as a business metric is one of the most important indicators of your business’s profitability as net profit margin measures how much actual profit is netted for each dollar of revenue made.
Additionally, this business metric is also important because it helps in assessing whether an increase in your revenue translated or did not translate into increased profitability for your business. However, remember that before you can calculate your company’s net profit margin, you will first need to calculate your company’s net income.
The formula for calculating net profit margin is:
Net Profit Margin = (Net income / Total revenue) x 100
Gross Profit Margin
Unlike in the case of net profit margin, gross profit margin as a business metric will show your company’s profits before subtracting the interests, taxes, and operating expenses like rent, utilities and wages from it.
This is an important financial business metric because a healthy gross profit margin is indicative of whether your business is able to cover all of its expenses or not.
The formula for calculating your gross profit margin is:
Gross Profit Margin = (Revenue - Cost of goods or service sold) / Revenue
Current Ratio
In order to stay financially fit, your company should be liquid enough to be able to pay off all its financial obligations. The current ratio hence is a crucial financial business metric because it measures your company’s ability to pay off its financial obligations that are due within a year. This business metric is calculated as a ratio of current assets to current liabilities.
Current assets are those assets that are expected to convert to cash within a year (such as account receivable), whereas current liabilities are those obligations that are due within a year (such as account payable).
The formula for calculating your current ratio is:
Current Ratio = Current assets / Current liabilities
Generally, a current ratio that is above 1.0 is considered healthy. However, if your business has a current ratio of 2.0, then it indicates that your business has two times more current assets than it has current liabilities. However, if your business’s current ratio is 3.0, then it indicates that your business has not been handling its working capital efficiently.
What needs to be noted here is that the current ratio is a quick and short-term business metric that is indicative of your business’s solvency, and hence it must be calculated regularly.
Working Capital
Working capital is again an essential business metric because while every business needs money to meet its short-term needs, having too much cash on hand at any given time does mean that your company is wasting opportunities to engage in investing activities and hence invest in future growth.
This is where working capital as a business metric comes into play. By keeping a close eye on working capital, your company would be able to figure out ways through which it can free up cash, use its funds more effectively, learn to reduce dependence on outside funding, and even be able to get a clear sense of your business’s liquidity.
The formula for calculating your business’s working capital is:
Working Capital = Current assets - Current Liabilities
Accounts Receivable Turnover Ratio
Your business should be able to effectively bill and collect payments from its customers or clients. Accounts receivable turnover ratio is thus that business metric that measures how effectively your accounts receivable department collects debts owed by clients.
The higher is your accounts receivable turnover ratio, the more efficient your company is in collecting its payments. This also makes it more likely for your company to have cash on hand to fulfill its own financial obligations as well as be able to invest for future growth.
However, a lower turnover ratio can be an indication of illiquid customers or slow-to-pay customers, or an inefficient debt collection process, all of which can stunt your business’s growth. In this case, you will need to find ways through which you can improve your ratio, improve your cash flow and secure your business’s growth.
The formula for calculating your business’s accounts receivable turnover ratio is:
Accounts Receivable Turnover Ratio = Net credit sales in a given period / Average accounts receivable of the period
Percentage of Accounts Payable Overdue
Along with accounts receivable, accounts payable is also an important business metric to keep track of. This is because the percentage of accounts payable overdue can indicate cash flow problems.
In fact, the more overdue payments your business has, the higher are the chances of your business having trouble paying its suppliers. This thus indicates the need for either developing a new business strategy or arranging for new funding. In contrast, the lower the percentage of your business’s accounts payable overdue, the better is your business is paying its debts on time.
The formula for calculating your business’s percentage of accounts payable overdue is:
Accounts Payable Overdue Rate = (Accounts payable overdue / Total accounts payable) x 100
SaaS Metrics to Track
Many of the important SaaS metrics overlap with key sales and marketing metrics. For instance, churn rate, customer lifetime value, customer acquisition costs, customer retention. All of these metrics are also very important for SaaS companies because they have a subscription-based business model that relies heavily on keeping its customers and not just on acquiring them.
However, some of the other additional metrics that can provide you more detailed and actionable insights into your SaaS company are:
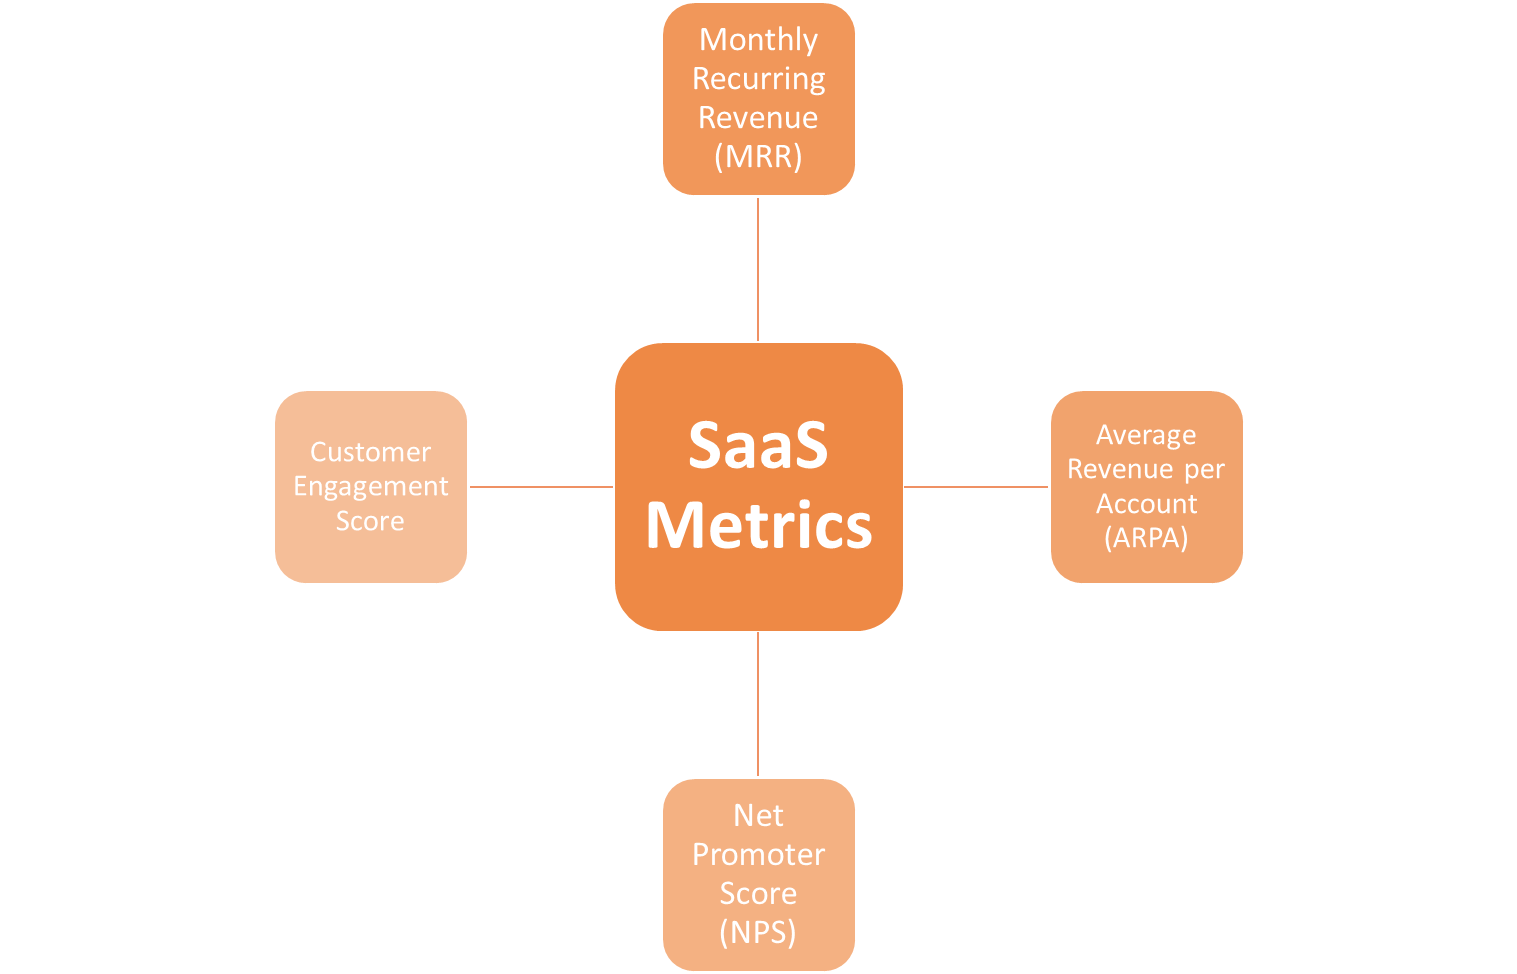
Monthly Recurring Revenue (MRR)
Monthly recurring revenue is a key business metric if you are a SaaS company because it is a summary of all the revenue that you are expecting to receive in a particular month. In order to calculate your business’s MRR, you will just have to add up all the total revenues from your paying customers for the given month.
However, if your SaaS business is more complex, then you will also have to factor in additional MRR calculations. For instance,
- Calculating MRR of new acquisitions in a month.
- “Expansion MRR” from existing customers who have upgraded their accounts or added new product features or users.
- “Churn MRR,” which will measure all the monthly revenue that you have lost due to downgrades or cancellations by your customers.
Hence, tracking your SaaS’s business’s MRR metrics will help you understand the revenue changes of your business better while also letting you assess how well or not well your sales team is doing. Additionally, it will also help you know whether your customers are satisfied or dissatisfied with your business and figure out where to improve so as to get positive customer feedback.
The formula for calculating your business’s MRR is:
MRR = Total revenue from paying customers in a given month
For example, if you have 100 customers paying $1,000/month and 100 customers paying $3,000 a month, then your MRR for that month would be = (100 x $1,000) + (100 x $3,000) = $400,000.
However, if you want to calculate your business’s new MRR, then its formula is:
New MRR = Total number of new customers in a month x Revenue brought in by new customers in a month
For example, if you have added 50 more customers in the given month, out of which 25 customers are those that pay $500/month and the remaining 25 are those that pay $1,000/month, then your new MRR for that month would be = (25 x $500) + (25 x $1,000) = $37,500.
Calculating new MRR is important because the key to your business’s revenue growth is acquisition of new customers.
Now, if you want to calculate expansion MRR of your business, then the formula to be used is:
Expansion MRR = Total number of customers who upgraded in a month x (New revenue - Old revenue)
For example, if 10 of your customers have upgraded from $500/month plans to $1,000/month plans, then your expansion MRR would be = ($1,000 - $500) x 10 = $5,000.
This business metric hence shows how you have expanded your revenue without having to add new customers. It is because of this reason that this business metric is also important for tracking, monitoring, and analyzing.
Lastly, if you want to churn MRR of your business, then the formula to be followed is:
Churn MRR = Total number of customers who canceled or downgraded x Lost revenue
For example, if three of your customers canceled their $500 subscriptions and two of your customers downgraded from a $1,000/month plan to a $500/month plan, then your churn MRR would be = (3 x $500) + (2 x $500) = $2,500.
If your churn MRR is significant, then it is an indication of your customers' dissatisfaction with your services, and this is why tracking this business metric is so crucial.
Average Revenue per Account (ARPA)
This business metric is also known as annual revenue per unit (ARPU). ARPA is a vital business metric because it calculates the average revenue generated by each account of your business, usually on a monthly basis. However, in order to be able to calculate your ARPA accurately, you will need to have access to your billing or accounting system.
Another importance of tracking this business metric is that it will help you understand your business’s revenue evolves over a period of time. In fact, some of the SaaS businesses track the ARPA of their long-term customers and then compare it with the ARPA of new customers in order to identify if their new acquisitions have different purchasing preferences. This hence helps them update their sales persona accordingly so that their marketing efforts can be updated accordingly as well.
The formula for calculating your business’s ARPA is:
ARPA = MRR / Total number of customers in the given month
For example, if your business’s MRR is $100,000 and you have 500 customers, then your average revenue per account is = $100,000 / 500 = $200.
Net Promoter Score (NPS)
NPS as a business metric estimates the likelihood of your users recommending your service to others. This business metric is, therefore, especially important if yours is subscription-based business because your financial health depends on retaining as many customers as possible and preferably getting them to upgrade and/or refer your product to their friends and colleagues.
Usually, NPS is measured through a one-question survey to your business’s customers- “How likely are you to recommend us to a friend or colleague?” with a 0-10 scale where 0 means they will not recommend and 10 means that they definitely will recommend.
The responses you receive will then have to be categorized as follows:
- Detractors: Respondents who answer with a number from 0-6
- Passives: Respondents who answer with a number 7 or 8
- Promoters: Respondents who answer with a number 9 or 10
The formula for calculating your business’s NPS is:
NPS = Percentage of promoters - Percentage of detractors
For example, if you have received 100 survey responses and out of these 20 are detractors, 50 are promoters, and 30 are passives, then your NPS would be = 50% - 20% = 30%
Customer Engagement Score
As a business metric, the customer engagement score gives you insights into how much and how often your customers engage with your SaaS solution. It measures engagement activities like how often your customers login, how often they use a specific tool and its features, and what do they use your software the most for.
This will also help you determine your niche, which will not only help you with niche marketing and figuring out your marketing attribution, but also address any customer pain points that you are yet to solve. It will basically help you make your product and its marketing better and more relevant, which will ultimately lead to increased sales and revenue for your business.
How the insights from this metric are to be understood is that if your customer regularly uploads files and uses various features of your product throughout the day, then they are more engaged than a customer who just logs in once a day to check for reminders or alerts. This understanding will also help you predict customer churn and be proactive about creating solutions to retain your valuable customers.
There is no standard formula to calculate a business’s customer engagement score, and hence your business will have to create its own model and system to do so. To do so, you should start by creating a list of actions of inputs that will be able to predict your customers’ engagement. This you can derive from the habits of your long-term customers.
Once you have made this list, you should score each of the actions or input based on how critical it is to your customer retention and then add them up to know your customer’s engagement score. Remember, you will have to constantly evaluate your rating system in order to ensure that you are picking the right features to predict engagement, retention, and churn.
Human Resources Metrics to Track
It is important to track human resources metrics because they showcase your employee’s satisfaction as well as performance. Generally, these metrics track data related to employee turnover, development and engagement, and your company's culture and training costs.
All of these will help you identify your workforce’s trends and dynamics while enabling you to proactively solve potential issues like burnout or ineffective training programs. Some of the key HR metrics that should be tracked by your business are:
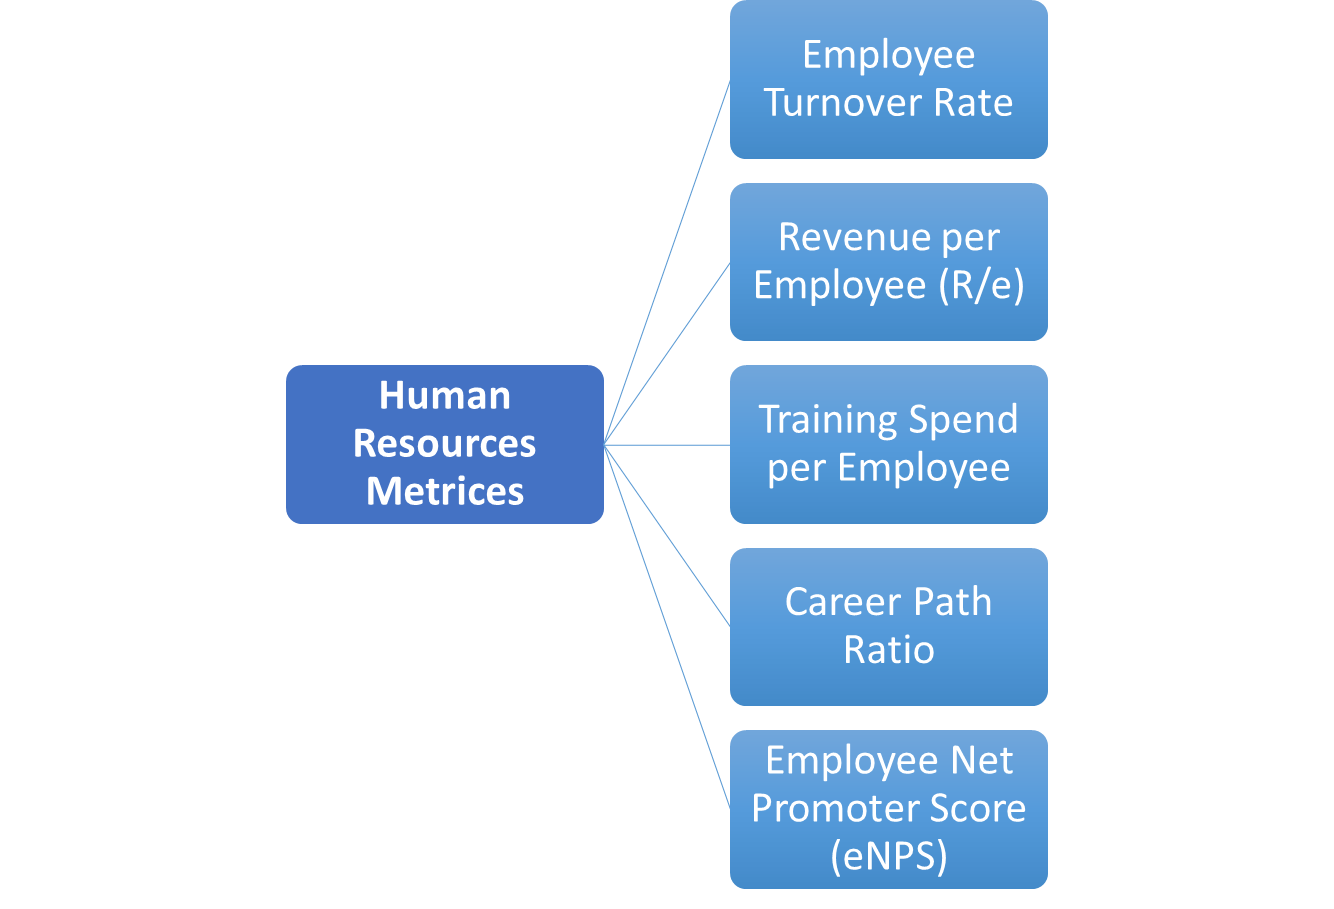
Employee Turnover Rate
While it is natural for every company to lose its employees from time to time, the lesser the turnover, the better it is for the company. A high turnover rate indicates your workers’ unhappiness, an unsuitable pattern of hiring your employees such that they are not fit for the position, and even talent management issues, where you are unable to retain highly talented employees.
Generally, an average turnover rate between 10% and 20% is little cause of concern. But, what needs to be remembered here is that this rate varies from industry to industry and business to business. However, the basic rule of thumb to be followed here is that if your turnover rate is higher than the industry average, then it suggests that your competitors are more attractive to your employees.
Another thing to take into consideration here is that turnover could be voluntary as well as involuntary, and in order to get comprehensive insights, it is important to measure both. In fact, you can even benefit from calculating the turnover rate for high performers.
The formula for calculating turnover rate is:
Turnover Rate = (Number of separations in a given period / Average number of employees in a period) x 100
Revenue per Employee (R/e)
While this is also regarded as a sales metric sometimes, revenue per employee is an important business metric from HR’s perspective as well because it helps you to know the productivity of your entire workforce.
This is because the higher the revenue is per employee, the more productive your business is with your resources being used efficiently as well. Together, this will lead to higher profits for your business.
However, because revenue per employee will vastly differ from one industry to another, it is important to make comparisons with only those businesses that are similar to yours. For instance, an eCommerce company will have fewer staff than a brick-and-mortar store of the same industry. The revenue per employee should hence be calculated, keeping such factors in mind.
The formula for calculating your business’s revenue per employee is=
Revenue per Employee = Total revenue / Current number of employees
Training Spend per Employee
In order to know whether your company is getting a return on its investment, it is important for it to track the training expenses it has incurred. For instance, companies with high turnover ratios may be investing more in training an employee than the revenue that the employees have generated before leaving the company.
Additionally, tracking training expenses as a business metric alongside employee productivity and profitability will also be helpful to your business in determining whether your training strategies are effective or not.
The formula for calculating your business’s training spend per employee is:
Training Spend per Employee = Total training expenses / Total number of employees
Career Path Ratio
This business metric will help you track the ratio of vertical promotions to lateral transfers in your company. It is an important business metric for your business as well as for your employees.
This is because by getting insights into these details, your company would be able to promote long-term job satisfaction as employees generally need room to grow and learn new skills, whether it is through vertical promotion or by applying for a lateral move.
Another importance of this business metric is that it is generally more cost-effective for companies to find the talent they require from their own employees rather than from new recruits. In fact, by tracking the career path ratio, your company would be able to measure its employees’ mobility.
The formula for calculating your business’s career path ratio is:
Career Path Ratio = Total promotions / (Total promotions + Total transfers)
In career path ratio, values above 0.7 indicate more vertical promotions, and therefore your company is getting more “top-heavy” and requiring it to start expanding its employees’ roles laterally. In contrast, though, values under 0.2 indicate more lateral transfers while also suggesting that not enough of your employees are being primed for promotion.
Employee Net Promoter Score (eNPS)
eNPS is a business metric that is an effective measure of your employees’ satisfaction. eNPS offers a standardized approach in understanding how your employees feel about your company by using a scale of 0 to 10.
Additionally, eNPS also measures how likely your employees are to recommend your company as a place to work and your products or services as something that is reliable and should definitely be used.
As any standard 0-10 scale,
- Scores of 0-6 are detractors who are unlikely to recommend
- Scores 7-8 are passives
- Scores 9-10 are promoters who are highly likely to recommend
The formula for calculating your business’s employees’ net promoter score is:
eNPS = Percentage of promoters - Percentage of detractors
Other Business Metrics to Track
Some of the other business metrics that would be useful for your inventory teams, C-suite, if you are a manufacturing company and for your other business departments and industries are:
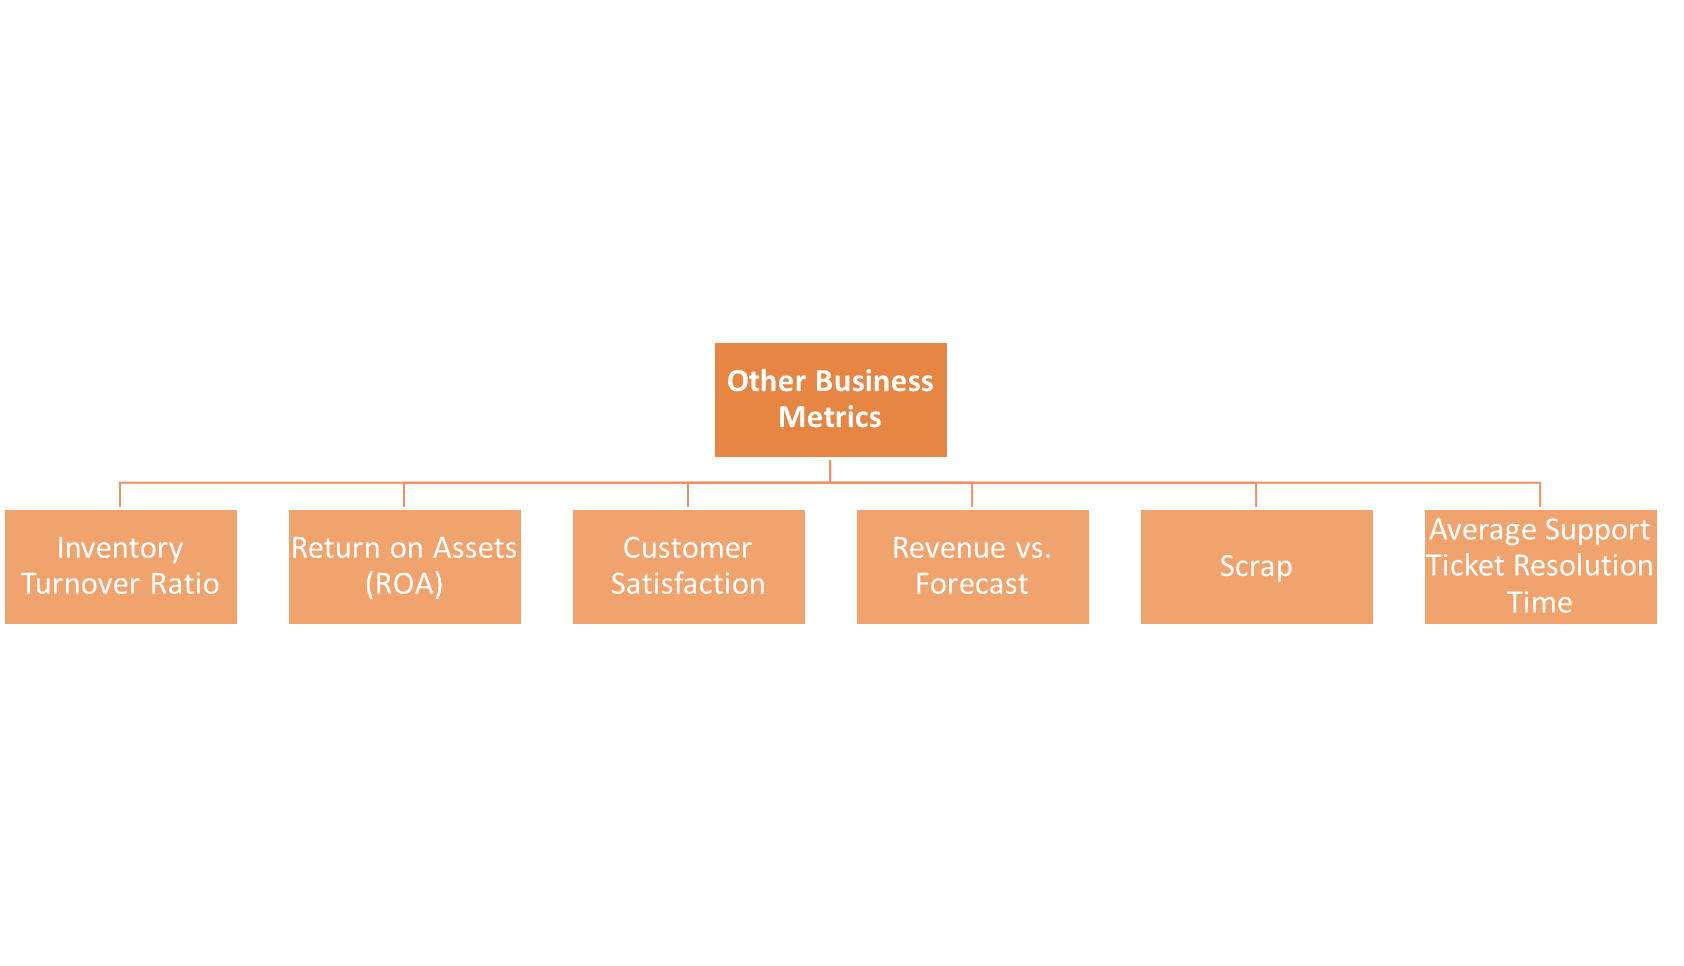
Inventory Turnover Rate
Inventory turnover ratio is a crucial financial metric if you are a manufacturing and retail company. This is because this business metric tracks how many times a company sells and replaces its inventory over a given period.
The higher this number is, the better it is because it means that your company is holding less inventory, and holding inventory is usually an expensive affair. Additionally, a higher number also tends to indicate healthy demand for your products or services.
However, if your high inventory turnover rate is followed by lost sales due to a certain item’s unavailability, then it does indicate the probability of your company running too lean.
The formula for calculating your business’s inventory turnover rate is:
Inventory Turnover Rate = (Cost of goods sold / Average inventory) x 100
Return on Assets (ROA)
This business metric calculates the per-dollar profit that your company is making on its assets and is then used to assess its profitability. ROA is an especially important business metric if you are part of a banking industry because bank assets largely consist of money that is loaned, making cash flow harder to analyze than it is for other types of businesses.
The formula for calculating your business’s ROA is:
Return on Assets = Net income / Total assets
Customer Satisfaction
Just like employee satisfaction, customer satisfaction is also crucial for the success of your business. One of the ways of measuring your customers’ satisfaction is through a customer satisfaction scale which usually has simple follow-up questions on each customer’s experience. One of the most common questions here is, “on a scale of 1 to 10, how satisfied were you with X experience?” Here, 1 indicates extremely unhappy, and 10 indicates extremely happy.
You would then have to add up all your scores and divide that figure by the number of respondents in order to know your customers’ satisfaction value. The higher the number, the more satisfied are your customers with their experience with your business, products, and services.
In contrast, if your scores are low, then they are indicative of the need for you to address potential issues or reinforce effective practices like proactive customer service, digitized customer services, and hiring a customer success manager.
Revenue vs. Forecast
This business metric is especially for the executives and top-level managers as it will reflect the overall health of your business by comparing your business’s actual revenue with its forecasted revenue. It would hence be able to throw light on the fact whether your company’s performance is matching with its expectations, or is it coming up short.
If in case, the reality is coming up shorter than the expectations, then your executives will have to identify what is causing this variance. The formula for calculating this variance between the actual revenue and the forecasted revenue is:
Variance Percentage = [(Actual - Forecast) / Actual] x 100
Scrap
For manufacturing teams, measuring scrap or waste is a key business metric. This metric especially measures the amount of rejected or unusable manufactured items, usually due to manufacturing defects and which has hence become scrap from the manufacturing team’s perspective. Oftentimes, scraps can neither be reused nor can they be recycled, and that is why it is a cost that needs to be accounted for.
Scrap can either be measured in weight or as individual units or in volume, depending on the material used to produce a certain item. The formula for calculating your business’s scrap is:
Scrap = (Total scrap units/volume/weight / Total product run in units/volume/weight) x 100
The lesser your scrap’s value is, the more effective is your business’s manufacturing process. In fact, an effective manufacturing process will also help in increasing the ratio of your operating income to your operating expenses.
Average Support Ticket Resolution Time
This business metric is an especially key metric for your customer service department because it tracks how long it generally takes to resolve the support tickets.
While response time is important, resolution time is a much better metric here because it is more comprehensive. This is because, usually a short resolution time will indicate a quick response as well, but it rarely ever assures the other way round.
In order to keep your customers happy and satisfied, your support team should strive to have fast resolution times. In fact, average support ticket resolution times should be tracked continuously, and if there are any spikes in the resolution time, their reasons should be investigated.
The spike could be due to reasons like a team member being on vacation or due to it having taken longer in patching a software bug. Knowing the reasons would again help you in keeping your resolution times to the minimum.
How Can Deskera Help You Track Business Metrics?
Deskera is an all-in-one cloud-based software that will help your business run efficiently anytime, anywhere, and on any device. Deskera will help your business with accounting, CRM, inventory, payroll, and more, thus streamlining all the departments of your business under its single application.
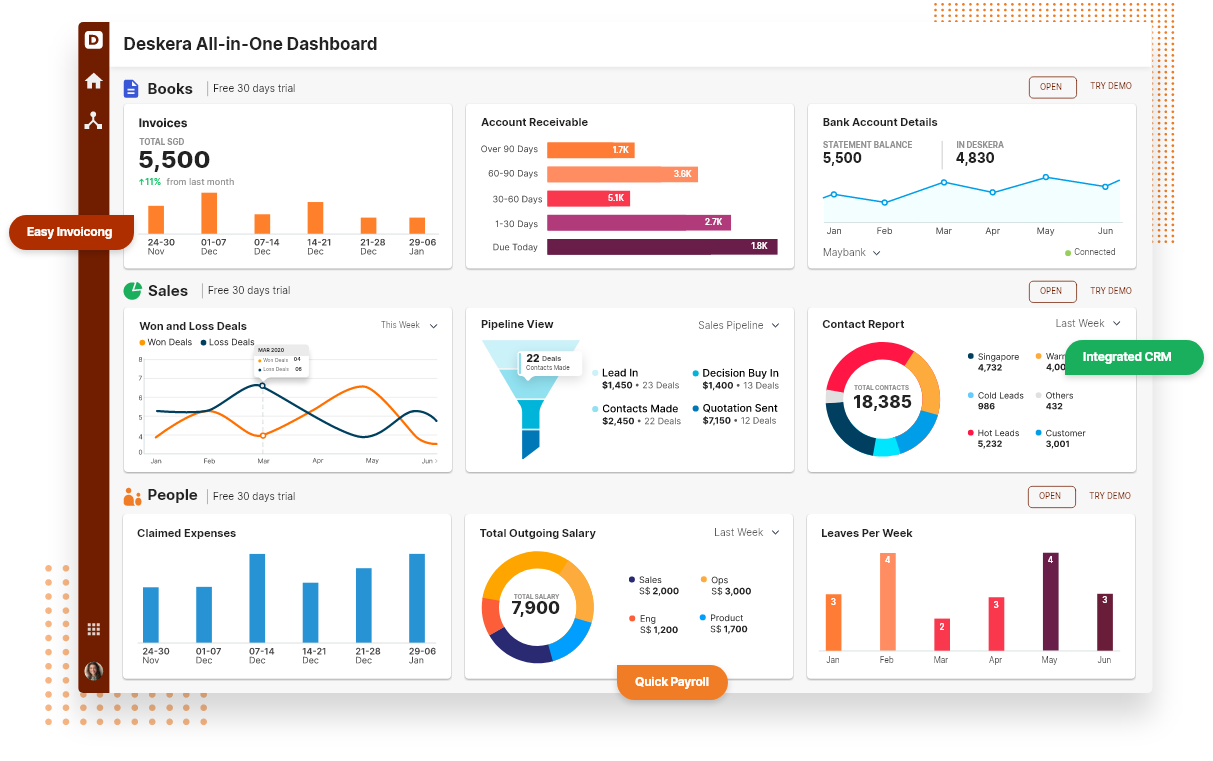
With Deskera Books, you would be able to manage your accounts, invoicing and financial reports. However, your customer relationships and deals would be managed by Deskera CRM, and your HR, payroll, and employees would be managed by Deskera People.
All of these will be integrated with each other, thus granting you with greater operational visibility, eliminating data redundancy, while also helping you track all your business metrics on one platform.
Check out Deskera's product in this video below:
Key Takeaways
Business metrics will help your company track various of your business operations like revenue growth, average, and fixed costs, cost of goods sold, contribution margin ratio and profits, employee turnover and satisfaction, customer satisfaction and churn rate, and many other such metrics which will help you assess how well your business is operating and where it can improve.
The vast scope of business metrics even provides you with a means to measure your business’s various departmental activities over a given period of time and identify the ways in which these departments interact and affect each other.
For the long-term success of your business, it is crucial for you to choose the right metrics and even the right number of metrics. What will help you with tracking these various business metrics is Deskera ERP. Deskera ERP will automate the process of tracking your business metrics while also ensuring that they are accurate and updated in real-time.
Furthermore, it will keep your several departments connected with each other which will help them in understanding how they are interconnected with each other and how they can improve their overall performance. All of these efforts will ensure your business’s success, higher profits, positive brand awareness, and a customer base that is loyal to your business.
Related Articles